Archive
Python: My Fake Data Generator P-5
Learning : Python: Functions, Procedures and documentation
Subject: About fake data P-5: (Fake Animal list)
Although I call this a Fake Animals list, but the names are for real animals, I am creating a json file fill of animals, each has name and type, also I add a key called information where I am giving a short summary about the data-set. Also I upload the data-set to my account in GitHub, so we can load the json file using Python requests library. The data-set will be updated frequently by adding more animals.
Standarizing: I will try to create all my data-sets with a standard information key, this key will show the following:
- Date: Will show the data-set crating date.
- Last Update: Will show the last update of the data-set file.
- Creator: Will be my name.
- Desc: Is a short description about the data-set.
- Legal: Is the copyright and the limits of using this data-set
To access this part of the data set you can run this code ..
 # Function to print-out the information key in the data-set

def get_info(adata):
    print('\n Information about Creatures data-set.')
    for each in adata['information']:
        for k in each.keys():
            print(' ', k + ": " + each[k])
Creatures data-set:This data set is containing the name of animals and their types, animal types are: mammals | insects | birds | reptiles. Our function def get_animals() will take three arguments: the data, the type of animal we want and the size, and it will return a list of animals names.
Here is the code. .
 # Function return a list of random animals names.


def get_animals(adata, atype, dsize):
    """
     Date: 17/12/2019
        Creator : Ali Radwani
        Function to return  X numbers of animal names. The data-set contain animals with
        four categories:
            - Mammals
            - Birds
            - Insect
            - Reptiles
    :param : dict: adata:
    :param : str:  atype:
    :param : int:  dsize:
    :return: list : t_names
    """
    t_names = []
    t_ind_list = get_type_index(adata,atype)

    t_size = len(t_ind_list)
    if dsize < t_size:
        for x in range (dsize):
            t_names.append(data['animals'][random.choice(t_ind_list)]['name'])
    else:
        print('\n  The {} data-set is less than data size you ask for. Maximum size is {} {}.'.format(atype,t_size,atype))

    return t_names

|
And here is the out-put ..

|
:: Fake Function List ::
| Function Name | Description |
| Color | To return a random color code in RGB or Hex. |
| Date | To return a random date. |
| Mobile | To return a mobile number. |
| Country | To return a random country name. |
| City | To return a random City name. |
| ID | To return X random dig as ID. |
| Time | To return random time. |
| Car’s Brand | |
| file_name | file name: list for fake file names. |
| Creatures | Random animal names of a certain type: Mammals, Birds, Insect, Reptiles |
| Done |
 Follow me on Twitter..
By: Ali Radwani
Python: My Fake Data Generator P-4
Learning : Python: Functions, Procedures and documentation
Subject: About fake data P-4: (Fake Dates)
The fourth function of our Fake Data Generator will be the date function, from it’s name this one will generate a FAKE Date in yyyy/mm/dd format. The function will have one argument (go_back) for range, the max-limit is current date (today) and mini-limit will be (1/1/1900), if the user did’t pass any thing for (go_back) then the range is (from current to 1/1/1900) and if the user pass (X) then the range will be ((current date) to current – X_YEARS). Also in dates we need to take care of Leap Years, In leap year, the month of February has 29 days instead of 28. To solve this in our function we can use two ways, first one (the easy way) we know that we are generating a random numbers for months and days; so we can say if the month is February, then days can’t be more than 28. But if we want this thing to be more realistic we need to add more conditions such as :
1. The year can be evenly divided by 4.
2. If the year can be evenly divided by 100, it is NOT a leap year, unless the year is also evenly divisible by 400. Then it is a leap year (February has 29 days).
'''
10/12/2019
By: Ali Radwani
To get Fake Date.

'''

import random, datetime

def fdate(go_back = 0):
    """
        ###   Fake Date Generator V.01  ###
        Date: 10.12.2019, By: Ali Radwani

        This function will generate and return a fake date in string format.
        The function accept one int argument go_pback.
        If go_past = X, and current year - X is less than 1900 then
        the range of FAKE time will be (current year to current year - X).

        If NO argument passed to the function, then default limit set to 1900.

        Default limits:  Date are from current (today) and back to 1900.

        Import: random, datetime

        Argument: int : go_back to set the upper limit of the date

        Return: str: dd/mm/yyyy

    """

    # Get current year.
    c_year = datetime.datetime.today().year

    # set the maximum year limit.
    if go_back > 0 :
        max_y_limit = c_year - go_back
    else :
        max_y_limit = 1900

    if max_y_limit < 1900 :
        max_y_limit = 1900

    yy = random.randint(max_y_limit, c_year)

    mm = random.randint(1,12)

    if mm in [1,3,5,7,8,10,12] :
        dd = random.randint(1,31)
    elif mm in [4,6,9,11]:
        dd = random.randint(4,30)

    else :
        # IF the month is February (2)
        if (yy % 4 == 0 ) or ((yy % 100 == 0)and (yy % 400 == 0)):
            # It is a leap year February has 29 days.
            dd = random.randint(1,29)

        else : # it is NOT a leap year February has 28 days.
            dd = random.randint(1,28)

    d = (str(dd) +'/'+ str(mm)+'/' + str(yy))

    return (str(dd) +'/'+ str(mm)+'/' + str(yy))


# To check the output.
for x in range (30):
    print(fdate())
<
Here is a screenshot of the code, also available on the Download Page . . .

|
:: Fake Function List ::
| Function Name | Description |
| Color | To return a random color code in RGB or Hex. |
| Date | To return a random date. |
| Mobile | To return a mobile number. |
| Country | To return a random country name. |
| City | To return a random City name. |
| ID | To return X random dig as ID. |
| Time | To return random time. |
| Car’s Brand | |
| file_name | |
| Done |
By: Ali Radwani
Python: My Fake Data Generator P-3
Learning : Python: Functions, Procedures and documentation
Subject: About fake data P-3: (Fake Time)
The third function of our Fake Data Generator will be the Time function, Fake Time is very easy to implement, all we need is call random function two times, one for minutes (0,60) and another for hours (0,12 or 0,23) based on the argument s (style).
Let’s start: First we need to Import random, the function def ftime() will take one integer argument (s) represent the time style.
If the s = 12 then the time format will be regular start from 1 and end at 12, the number will be generated randomly using random.randint, also we will select random.choice([‘ AM’,’ PM’]) to be added to the time and return it back.
If the s = 24 or nothing been passed then the time format will start from 0 to 23 (Military Time Format). Another random integer (0,60) to be generated as minutes.
'''
  Fake Data Generator
  Function for:  Fake Time
  Ali Radwani
  11/12/2019
'''

import random

def ftime(s = 24):

    """
        ###   Fake Time Generator   ###
        Date: 11.12.2019, By: Ali Radwani

        This function will generate a fake time, the
        function accept one int argument s.

        If s = 12 function return Regular time format,
        If s = 24 function return military time format
        (the 24 format system).

        If No argument passes then default time system
        format will be 24 system (military time)

        Argument: int : s, if No argument then default is 24.

        Return: str : ftimes
    """

    m = str(random.randint(0,60))
    if (len(m)) == 1 :
            m = '0' + str (m)

    if s == 12 :
        h = str(random.randint(1,12))
        if (len(h)) == 1:
            h = '0' + h
    else :
        h = str(random.randint(0,23))
        if (len(h)) == 1:
            h = '0' + h

    ftimes = str(h) + ':' + str(m)
    if s == 12 :
        ftimes = ftimes + random.choice([' AM',' PM'])

    return ftimes

# Testing the function.
for x in range (10):
    print (ftime(12))
:: Fake Function List ::
| Function Name | Description |
| Color | To return a random color code in RGB or Hex. |
| Date | To return a random date. |
| Mobile | To return a mobile number. |
| Country | To return a random country name. |
| City | To return a random City name. |
| ID | To return X random dig as ID. |
| Time | To return random time. |
| Car’s Brand | |
| Foods | |
| Done |
By: Ali Radwani
Python: My Fake Data Generator P-2
Learning : Python: Functions, Procedures and documentation
Subject: About fake data P-2: (Fake ID)
Before we start i’d like to mention that with our last fcolor() function we write some comments in the first part of the function between three double quote(“””), and if we load the function and call help() as help(fcolor()) we will get that information on the python console as a help as in screen shot.

|
In this post we will write a function to generate a fake ID number, for ID’s there could be several styles, sometime we just want a random number without any meaning; just X number of random digits. Most of the time we need this number to be mean-full based on certain rules. For example, in Banks they may use some digits that indicate the branch. In sport club, they may include the date … and so-on.
Here we will write a function called key_generator(), the function will take two arguments (dig, s) dig is your key digits number, s is the style, if s = d then the first 6 digits of the key will be the date as ddmmyy + random digits, and if s = anything else or s not passed then the key will be as default (just x-digits). Let’s see the code.
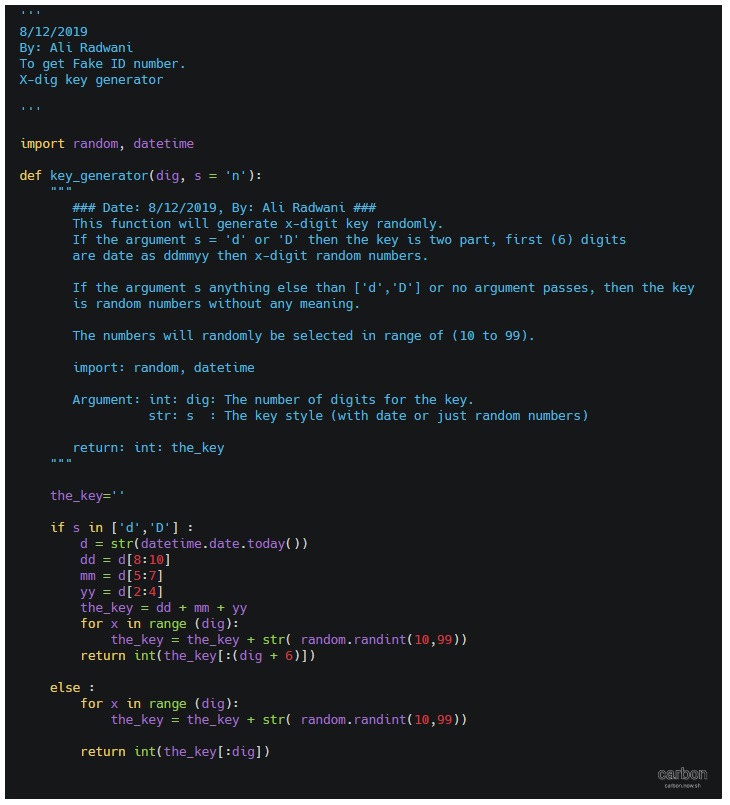
First the summary or say information about the function:
def key_generator(dig, s = 'n'):
    """
       ### Date: 8/12/2019, By: Ali Radwani ###
       Summary:
            This function will generate x-digit key randomly.
            If the argument s = 'd' or 'D' then the key is two part, first (6) digits
            are date as ddmmyy then x-digit random numbers.

            If the argument s anything else than ['d','D'] or no argument passes, then the key
            is random numbers without any meaning.

            The numbers will randomly be selected in range of (10 to 99).

            import: random, datetime

            Argument: int: dig: The number of digits for the key.
                 str: s  : The key style (with date or just random numbers)

            return: int: the_key
    """
Now, if the user pass s=’d’ then part of the key will be the current date, to do this we will call the datetime function in python and split it into dd,mm,yy. Here is the key_generator() function.
def key_generator(dig, s = 'n'):
    """
       ### Date: 8/12/2019, By: Ali Radwani ###
       Summary:
            This function will generate x-digit key randomly.
            If the argument s = 'd' or 'D' then the key is two part, first (6) digits
            are date as ddmmyy then x-digit random numbers.

            If the argument s anything else than ['d','D'] or no argument passes, then the key
            is random numbers without any meaning.

            The numbers will randomly be selected in range of (10 to 99).

            import: random, datetime

            Argument: int: dig: The number of digits for the key.
                 str: s  : The key style (with date or just random numbers)

            return: int: the_key
    """
    the_key=''
    if s in ['d','D'] :
        d = str(datetime.date.today())
        dd = d[8:10]
        mm = d[5:7]
        yy = d[2:4]
        the_key = dd + mm + yy
        for x in range (dig):
            the_key = the_key + str( random.randint(10,99))
        return int(the_key[:(dig + 6)])

    else :
        for x in range (dig):
            the_key = the_key + str( random.randint(10,99))

        return int(the_key[:dig])
|
In next Fake Data function we will try to write one to generate the date. It will be published on next Sunday.
:: Fake Function List ::
| Function Name | Description |
| Color | To return a random color code in RGB or Hex. |
| Date | To return a random date. |
| Mobile | To return a mobile number. |
| Country | To return a random country name. |
| City | To return a random City name. |
| ID | To return X random dig as ID. |
| Time | To return random time. |
| Done |
By: Ali Radwani
Python: My Fake Data Generator P-1
Learning : Python: Functions, Procedures and documentation
Subject: About fake data P-1
In the last post (Fake data-set) we play around with a library called “Faker” and we saw that we can call several functions to generate a fake data such as names, dresses, jobs and others. Once you use this you can figure out that a lot of data are random, some time they are random from a list or say a file. So as we are in learning sessions i thought it is a good idea if i start to write “My Fake Data Generator” functions, There is one thing that we (say I) have to consider; that’s the people behind “Faker library” are professionals and are a team not ONE person, there experience in writing codes and documenting thing are away better than whatever we will do, BUT the goal of this task is to coding, coding and coding.
So what are the functions that we will try to write? Here we will list down the functions that we will work on, this list will grownup as we working so it is not limited to that ever written now. Also i will try to do documentation for the functions so later if we call help() function in Python and pass a function name, we will get something from there. So let’s start and see the list of functions we will work on.
| Function Name | Description |
| color | To return a random color code in RGB or hex. |
| Date | To return a random date. |
| Mobile | To return a mobile number. |
| Country | To return a random country name. |
| City | To return a random City name. |
| ID | To return 11 random dig as ID. |
| Done |
So first one we will start with is “color”. Color function will return a value that present a color code, this number may be in decimal or hexadecimal, the function will take one argument (type) if type = d or D then the code will be in decimal, if type = h or H then the code will be in hexadecimal, if nothing passes then default will be hexadecimal.
First we need to import random
 # Generate FAKE color code.

def fcolor (t='h'):
    """
    This function named 'fcolor' will return a value that present a color code.
    Function will take one argument str (t), if t = 'd' or 'D' color code will be in RGB,
    if t = 'h' or 'H', color code will be in Hex,

    if nothing passes default color code will be Hex.

    Example:
        r,g,b = fcolor ('d')
        c = fcolor ('h') or  c = fcolor ()

    Argument: str : t

    return: ccode: list if RGB, str if Hex
    """
    ccode =[]

    r= random.randint (0,255)
    g= random.randint (0,255)
    b= random.randint (0,255)

    if t in ['d','D'] :
        ccode.append(r)
        ccode.append(g)
        ccode.append(b)
        return ccode
    else:
        # To convert the RGB color to Hex.

        for each in [r,g,b] :
            num = each
            cl=[]
            while num > 0 :
                hexr = num % 16
                if hexr < 10 :
                    cl.append(hexr)
                elif hexr == 10 :
                    cl.append('A')
                elif hexr == 11 :
                    cl.append('B')
                elif hexr == 12 :
                    cl.append('C')
                elif hexr == 13 :
                    cl.append('D')
                elif hexr == 14 :
                    cl.append('E')
                elif hexr == 15 :
                    cl.append('F')
                num = int(num / 16)

            cl.reverse()
            co=''
            for x in cl :
                co = str(co) + str(x)
            ccode.append(co)


        cc='#'

        for x in ccode :
            cc = str(cc) + str(x)
        ccode = cc

        while len(ccode)-1 < 6:
            ccode = ccode + '0'

        return ccode


 # Calling the function 3 times.
r,g,b = fcolor ('d')
print('  Color code as int RGB: ',r,g,b)
print('  Color code as list RGB:',fcolor ('d'))
print('  Color code as str Hex:',fcolor ())

[Output]:

  Color code as int RGB:  47 202 248
  Color code as list RGB: [59, 132, 99]
  Color code as str Hex: #85B060
This is the fcolor “Fake color” function, next post will be about the random ID number and what if we want it to be meaningful.
To Download my Python code (.py) files Click-Here
By: Ali Radwani
python: Fake Data-set
Learning : Python to generate fake data-set
Subject: About Fake data library
Most of the time when we working on a project, we need to test our procedures and functions with some data. In most cases we need just dummy data such as dates, names, address .. and so-on.
Last week, I was reading on the net and i fond an article about generating fake data using a library in PHP (PHP is a Computer Programming Language) so I start to find if we have one in Python! and the answer is YES there is a library that we can import called ‘Fake’. I start to work on it and discover it. This post is about the Fake Data-set Library.
The library called ‘Faker’ and we need to install it in our python environment, i use : pip install Faker to install it. In it’s documentation we can use some properties like : name, city, date, job .. and others. So if we want to generate a fake name we write this:
# Using lib:fake to generate fake name

print(fake.name())
[Output]: Victoria Campbell
Here is a screen-shot from Jupyter notbook screen.

|
To generate more than one name we can use for loop as:
# Using lib:fake to generate (X) fake name

for x in range (10) :
    print(fake.name())
[Output]: Jared Hawkins
Michael Reid
Ricky Brown
Mary Tyler
Kristy Dudley
Karen Cain
Jennifer Underwood
Desiree Jensen
Carla Rivera
Brandon Cooper
Other properties that we can use are :address, company, job, country, date_time and many other, and with all this we can create a data-set full of fake data.
So if we want to create a fake data-set contain:
Name, Date-of-birth, Company, Job, Country as one person data we will use it like this:
# Using lib:fake to generate (X) person fake data
# Data-set contain: Name, Date-of-birth, Company, Job, Country
p_count = 1
for x in range (p_count):
    print('Name:',fake.name())
    print('DOB:',fake.date())
    print('Company:',fake.company())
    print('Job:',fake.job())
    print('country:',fake.country())


[Output]:
Name: Crystal Mcconnell
DOB: 2002-09-30
Company: Bailey LLC
Job: Insurance underwriter
country: Pakistan

|
Now if we want to store the person data in a dictionary type variable and use it later, we can do this as following:
# Using lib:fake to generate (X) person fake data and store it in a dictionary
people_d ={}
p_count = 5
for x in range (p_count):
    ID = x
    people_d[ID]={'name':fake.name(),'date':fake.date(),'company':fake.company(),'job':fake.job(),'country':fake.country()}

# To print-out the people_d data-set.
for x in people_d :
    print(people_d[x])
Just in case we want a complicated ID we can use a random function (8-dig) integer, or combining two fake numbers such as (fake.zipcode() and fake.postcode()) just to make sure that we will not have a duplicate ID.
Using fake library will help a lot, and it has many attributes and properties that can be inserted in a data-set. For more information on this document you may read it here: Fake Library
To Download my Python code (.py) files Click-Here
By: Ali Radwani
Python: Machine Learning – Part 3
Learning :Python and Machine Learning Part 3
Subject: Implementation and saving ML-Model
After creating a data-set and use it to train a ML model and make sure that it works fine and give a height accuracy predictions (Click here to read: Python and Machine Learning Part 2 ), we may or say we need to keep this model trained and re-use it on any actual data. In many real-life ML to training the model may take time with huge train data in image recognition or voice recognition models, so we need to keep the model trained even if we exit the application. To do this in sklearn we will use the “Model persistence” document page and use the joblib serialization.
First we need to import joblib , also import so to print out the file name and the path, we will use two functions in joblib (dump and load) in save_trained_model we will use the dump. Her is the code.
 # Function to save a trained ML-Model

  import joblib, os  # To Import  joblib and os

  def save_trained_model(model_name):

      print('\n  You select to save the trained ML model.')
      ml_name = input('  Enter a file name: ')
      joblib.dump(model_name, ml_name)
      print('\n  --> ML Model been saved.\n')
      print('   File Name is :',ml_name)  # To print-out the file name
      print('   File Path is :',os.path.abspath(ml_name))  # To print-out the file path
      print('\n\n Do you want to save the ML trained Model? (Y,N): ' )
      if input('') in ['y','Y'] :
        save_trained_model(ML_trained_model)
Now after we save our trained ML-Model we want to load it and use it in our ML program without training our machine. I will use the function new_test_data() from part 2 and pass the ML trained model to it. And to do this, first we need to load the trained ML-Mode. So let’s do it.
 # Function to load trained ML-Model

def load_ML_Model(ML_filename):
    the_trained_model= joblib.load(ML_filename)

    return the_trained_model

# we call the function in the main application code.
ML_model = load_ML_Model(ML_t_model_filename)
And now we will call our new_test_data() function and pass ML_model to see the prediction.
 # Function to load trained ML-Model


def new_test_data(ML_model):
    print('\n\n====================================================')
    print('---------  START PREDICTION  for New Data Set ---------')
    print('\n   In this function a new data set will be generated, ')
    print('  and a trained ML-Model for "mouse on the coordinate plane" ')
    print('  will be loaded from the disk. So we will not train the Model.')
    #print('  So we will not train the Model. ')
    #print('  will use the IF loops.')

    new_data_size = 1000
    new_data_range = 100
    print('\n\n  The new data range is {}, and the new data size is {}.'.format(new_data_range,new_data_size))

    # generate new data
    new_test_data1= []
    for x in range (new_data_size):
        new_test_data1.append([round(random.uniform(-new_data_range,new_data_range),2),round(random.uniform(-new_data_range,new_data_range),2)])

    print('\n  This is the prediction for the New Data set..\n')
    # Do prediction using ML_model.
    prediction = ML_model.predict(new_test_data1)
    cot = 0
    # check the predictions accuracy .
    for i in range (len(prediction)) :
        if prediction[i] =='Up_r':
          if ((new_test_data1[i][0]) > 0 and (new_test_data1[i][1]) > 0) :
            cot = cot + 1
        elif  prediction[i] =='Up_l':
          if ((new_test_data1[i][0])  0) :
            cot = cot + 1
        elif  prediction[i] =='D_r':
          if ((new_test_data1[i][0]) > 0 and (new_test_data1[i][1]) < 0) :
            cot = cot + 1
        elif  prediction[i] =='D_l':
          if ((new_test_data1[i][0]) < 0 and (new_test_data1[i][1]) < 0) :
            cot = cot + 1

    print('\n  We count {} correct prediction out of {} Instances.'.format(cot,(new_data_size)))
    print('\n  The Accuracy is:',round((cot/len(prediction))*100,3),'%')

|
To Download my Python code (.py) files Click-Here
Python: Machine Learning – Part 2
Learning :Python and Machine Learning Part 2
Subject: Requirements, Sample and Implementation
Machine Learning Implementation : In the previous post (Click to Read: Python and Machine Learning Part 1) we start to learn about the ML Machine Learning and we use the sklearn model with Iris data-set. In this post we will generate our own data-set and tray to pass it to the ML model and find-out if the result are satisfying our needs.
First of all let’s talk about the data we want to collect, since we are doing tests and we can’t do anything on the accuracy checking part, I will select a very easy data so we can make sure that IF our ML-model select the right labels. So I will write a function to generate numbers (two pairs) positives and negatives to present the mouse location on the coordinate plane and the labels will be:
Up_r = Up Right, Up_l= Up Left,
D_r= Down Right, D_l= Down Left
So we have (4) classes 20 Instances in each, that’s 80 Instances in total.
The data will be passed into get_test_train_data() function, and it will return train, test data and labels, then we will train the model using the train_data() function, after that we will run the model on the test data to see if the model succeed in predicting the correct labels.
In this post I will cover the function that will generate the data and converting the data set into object data-set so we can use it in sklearn model without changing our code in part-1. I will use same data-set names as in sklearn Iris data-set.
Also we will write some information or say summary about the data we have and classes. So let’s see this part first..
   ## Data Set Characteristics :::
      Creator: Ali Radwani 26/11/2019

     Summary:
              This function will generate a dataset for Machine Learning for
              test and learning purpose. Numeric x,y represent the position
              of the mouse on the coordinate plane.
              Up_r = Up Right, Up_l= Up Left, D_r= Down Right, D_l= Down Left

     Number of Instances: 80 (20 in each of four (4) classes)
     Number of Attributes: 2 numeric (x,y), predictive attributes and the class.
     Attribute Information:
                 x (Position)
                 y (Position)
              class:
                 Up_r
                 Up_l
                 D_r
                 D_l
Once we create the data-set object we can append this information as description, adding descriptions to your data and applications is a good habit to learn and to have.
What is our data-set: From the summary part above we can see that we need to write a function to randomly generate two float number ranged from (-N) to (+N), N is our data_range. We assuming that these two numbers (pairs) are x, y of the mouse on the coordinate plane, so depending on each pairs (if it is negative or positive) we will add the corresponding class name, at the end we will have a list with tree values: x,y,label. Let’s see the code .
 # Function to generate data-set

  def data_set_generator():

      d_size = 400     # data-set size
      d_range = 200    # Data-set range
      data_list=[]
      nd1=[]

 # FOR loop to generate the random float numbers
      for x in range (d_size  ):
          nd1 =([round(random.uniform(-d_range,d_range),2),round(random.uniform(-d_range,d_range),2)])

 # Here we append the x,y pairs with labels.
          if nd1[0] > 0 and nd1[1] > 0 :
            data_list.append([nd1[0],nd1[1],'Up_r'])
          if nd1[0]  0 :
            data_list.append([nd1[0],nd1[1],'Up_l'])
          if nd1[0] > 0 and nd1[1] < 0 :
            data_list.append([nd1[0],nd1[1],'D_r'])
          if nd1[0] < 0 and nd1[1] < 0 :
            data_list.append([nd1[0],nd1[1],'D_l'])


 # We use shuffling the data-set to mix the data more
      for x in range (5):       # To mix the data
          random.shuffle(data_list)

      return data_list   # Return the data-set
 |
During writing the Machine Learning ML code to use Iris data-set, the data itself, the labels and other parts was called as an object from the main data-set. So here we need to create several sets of our data then we append them all to-gather. First I will split the data into two sets, one for the data and one for the targets(labels).
 # Function to prepare data-set

def dataset_prepare(the_dataset):
      '''
      input: dataset
      The function will split the dataset into 2 sets, one for data (data_set)
      and one for labels (target_set)

      '''
      target_set = []
      data_set = []

      for x in range (len(the_dataset)) :
          data_set.append([the_dataset[x][0],the_dataset[x][1]])
          target_set.append([the_dataset[x][2]])

       return data_set, target_set
prepare data set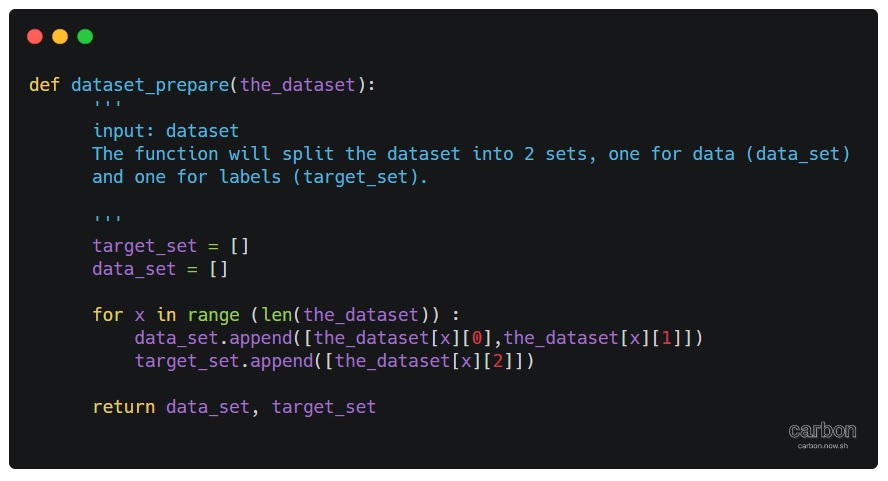
|
With above two functions we can now train our model and test it to see accuracy predictions. To make sure again that we can let our ML model to predict more new data-set, I create another function that will generate another set of data, I create this function to see try or say to be confident that YES the model is working. So let’s see the code. .
 # Function to create New dataset

def new_test_data():
    print( '\n\n====================================================' )
    print( '---------  START PREDICTION  for new data set ---------' )
    print( '\n  This is new data set, not the test one.. so there is ' )
    print( '  no labels to do comparing and to get the accuracy we ' )
    print( '  will use the IF loops.' )
    new_data_size = 5000    # data-set size
    new_data_range = 300   # data-set range
    print( '  The new data range is {}, and the new data size is {}.'.format( new_data_range, new_data_size ) )

    new_test_data1 = []
     # To generate the new data set.
    for x in range( new_data_size ):
        new_test_data1.append( [round( random.uniform( -new_data_range, new_data_range ), 2 ),
                                round( random.uniform( -new_data_range, new_data_range ), 2 )] )

    print( '\n\n  This is the prediction for the New Data set..\n' )

    prediction = clf.predict( new_test_data1 )
    cot = 0

    # Here we start counting the accuracy
    for i in range( len( prediction ) ):

        if prediction[i] == 'Up_r':
            if ((new_test_data1[i][0]) > 0 and (new_test_data1[i][1]) > 0):
                cot = cot + 1
        elif prediction[i] == 'Up_l':
            if ((new_test_data1[i][0])  0):
                cot = cot + 1
        elif prediction[i] == 'D_r':
            if ((new_test_data1[i][0]) > 0 and (new_test_data1[i][1]) < 0):
                cot = cot + 1
        elif prediction[i] == 'D_l':
            if ((new_test_data1[i][0]) < 0 and (new_test_data1[i][1]) < 0):
                cot = cot + 1

    print( '\n  We count {} correct prediction out of {} Instances.'.format( cot, (new_data_size) ) )
    print( '\n  The Accuracy is:', round( (cot / len( prediction )) * 100, 3 ), '%' )
Wrapping-up: In this post we wrote a function to generate a data-set and split it into two parts one for training and one for testing. Then we test the model with fresh new data-set that been generated via another function. Here is a screenshot of the final result.

|
To Download my Python code (.py) files Click-Here
Python: Machine Learning – Part 1
Learning :Python and Machine Learning
Subject: Requirements, Sample and Implementation
Machine Learning: I will not go through definitions and uses of ML, I think there is a lot of other posts that may be more informative than whatever i will write. In this post I will write about my experience and learning carve to learn and implement ML model and test my own data.
The Story: Two, three days ago I start to read and watch videos about Machine Learning, I fond the “scklearn” site, from there I create the first ML to test an Iris data-set and then I wrote a function to generate data (my own random data) and test it with sklearn ML model.
Let’s start ..
Requirements:
1. Library to Import: To work with sklearn models and other functions that we will use, we need to import coming libraries:
import os # I will use it to clear the terminal.
import random # I will use it to generate my data-set.
import numpy as np
import bunch # To create data-set as object
from sklearn import datasets
from sklearn import svm
from sklearn import tree
from sklearn.model_selection import train_test_split as tts
2. Data-set: In my learning steps I use one of sklearn data-set named ” Iris” it store information about a flower called ‘Iris’. To use sklear ML Model on other data-sets, I create several functions to generate random data that can be passed into the ML, I will cover this part later in another post.
First we will see what is the Iris dataset, this part of information is copied from sklearn site.
::Iris dataset description ::
dataset type: Classification
contain: 3 classes, 50 Samples per class (Total of 150 sample)
4 Dimensionality
Features: real, positive
The data is Dictionary-like object, the interesting attributes are:
‘data’: the data to learn.
‘target’: the classification labels.
‘target_names’: the meaning of the labels.
‘feature_names’: the meaning of the features.
‘DESCR’: the full description of the dataset.
‘filename’: the physical location of iris csv.
Note: This part helps me to write me data-set generating function, that’s why we import the Bunch library to add lists to a data-set so it will appear as an object data-set, so the same code we use for Iris data-set will work fine with our data-set. In another post I will cover I will load the data from csv file and discover how to create a such file..
Start Writing the code parts: After I wrote the code and toned it, I create several functions to be called with other data-set and not hard-code any names in iris data-set. This way we can load other data-set in easy way.
The Code
 # import libraries

import numpy as np
from sklearn import datasets
#from sklearn import svm
from sklearn import tree
from sklearn.model_selection import train_test_split as tts
import random, bunch
Next step we will load the iris dataset into a variable called “the_data”
 # loading the iris dataset.

the_data = datasets.load_iris()
From the above section “Iris dataset description” we fond that the data is stored in data, and the classification labels stored in target, so now we will store the data and the target in another two variables.
 # load the data into all_data, and target in all_labels.
all_data= the_data.data
all_labels = the_data.target
We will create an object called ‘clf’ and will use the Decision Tree Classifier from sklearn.
 #  create Decision Tree Classifier

clf = tree.DecisionTreeClassifier()
In Machine Learning programs, we need some data for training and another set of data for testing before we pass the original data or before we deploy our code for real data. The sklearn providing a way or say function to split a given data into two parts test and train. To do this part and to split the dataset into training and test I create a function that we will call and pass data and label set to it and it will return the following : train_data, test_data, train_labels, test_labels.
 #  Function to split a data-set into training and testing data.

def get_test_train_data(data,labels):

  train_data, test_data, train_labels, test_labels = tts(data,labels,test_size = 0.1)
  return train_feats, test_feats, train_labels, test_labels
After splitting the data we will have four list or say data-sets, we will pass the train_data and the train_labels to the train_me() function, I create this function so we can pass the train_data, train_labels and it will call the (clf.fit) from sklearn. By finishing this part we have trained our ML Model and is ready to test a sample data. But first let’s see the train_me() function.
 #  Function train_me() will pass the train_data to sklearn Model.

def train_me(train_data1,train_labels1):
  clf.fit(train_data1,train_labels1)
  print('\n The Model been trained. ')
As we just say, now we have a trained Model and ready for testing. To test the data set we will use the clf.predict function in sklearn, this should return a prediction labels list as the ML Model think that is right. To check if the predictions of the Model is correct or not also to have the percentage of correct answers we will count and compare the prediction labels with the actual labels in the test_data that we have. Here is the code for get_prediction()
 #  get_prediction() to predict the data labels.

def get_prediction(new_data_set,test_labels2,accu):

  print('\n This is the prediction labels of the data.\n')

  # calling prediction function clf.predict
  prediction = clf.predict(new_data_set)
  print('\n prediction labels are : ',prediction,len(prediction))

  # print the Accuracy
  if accu == 't' :
    cot = 0
    for i in range (len(prediction)) :
      print(prediction[i] , new_data_set[i],test_labels2[i])
      if [prediction[i]] == test_labels2[i]:
        cot = cot + 1
    print('\ncount :',cot)
    print('\n The Accuracy:',(cot/len(prediction))*100,'%')
The accuracy value determine if we can use the model in a real life or tray to use other model. In the real data scenario, we need to pass ‘False’ flag for accu, because we can’t cross check the predicted result with any data, we can try to check manually for some result.
End of part 1: by now, we have all functions that we can use with our data-set, in coming images of the code and run-time screen we can see that we have a very high accuracy level so we can use our own data-set, and this will be in the coming post.

|
Result screen shot after running the Iris dataset showing high accuracy level.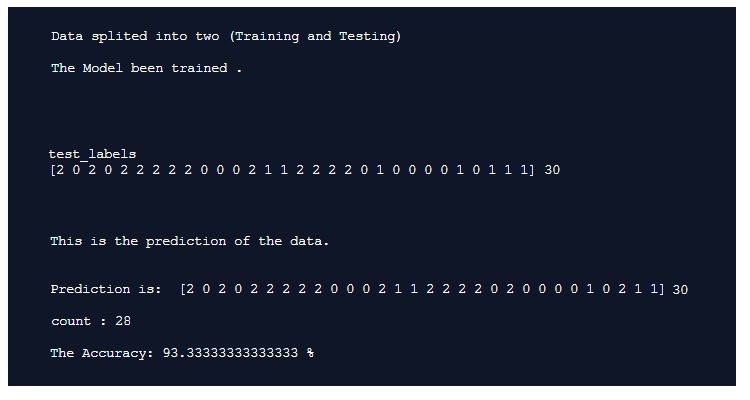
|
To Download my Python code (.py) files Click-Here
Python ploting
Learning : Plotting Data using python and numpy
Subject: Plotting Data
The best way to show the data is to make them as a graph or charts, there are several charts type and names each will present your data in a different way and used for different purpose. Plotting the data using python is a good way to show out your data and in coming posts we will cover very basic aspects in plotting data. So if we just want to show a sample for what we are talking about, we will say: we have a sample of hospital data for born childs (male m, female f, in years 200 to 2003).
:: Click to enlarge :: 
|
There are some libraries we can use in python to help us plotting the data, here are some of them. Matplotlib, Plotly and Seaborn are just samples of what we may use, in this post we will use the Matplotlib. To use Matplotlib we need to install it, so if it is not installed in your python you need to do so.
pip install Matplotlib
Then we need to import it in our code using :
import matplotlib.pyplot as plt
To show the data we need to have some variables that will be used in our first example, So the case is that we have some data from a hospital, the data are numbers of born childs (male m, female f) in years 2000 to 2003. We will store/save the data in list, we will have data_yesrs =[2000,2001,2002,2003], then we will have male born data in data_m=[2,2.5,3,5] and female born data data_f = [3,3.8,4,4.5], the chart will have two axis vertical is Y y_data_title =’In Hundreds’ and horizontal is X x_data_title =’ Years’, now to project all this information on a chart we use this code ..
import matplotlib.pyplot as plt
data_yesrs = [2000,2001,2002,2003] # years on X axis
data_m = [2,2.5,3,5]   # y data males born
data_f = [3,3.8,4,4.5]  # y data female born
y_data_title ='In Thousands'
x_data_title =' Years'

plt.title('New Born babies')

plt.plot(data_yesrs,data_m,'r-', data_yesrs,data_f,'b--')
plt.ylabel(y_data_title)
plt.xlabel(x_data_title)
plt.show()
Another way to plot the data were we can use a one line for each data set as:
plt.plot(data_x,data_m,’r-‘)
plt.plot(data_x,data_f,’b–‘)
We can see that male data is red line, and female data is blue dashes, we can use some line style to present the data as mentioned bellow:
‘-‘ or ‘solid’ is solid line
‘–‘ or ‘dashed’ is dashed line
‘-.’ or ‘dashdot’ is dash-dotted line
‘:’ or ‘dotted’ is dotted line
‘None’ or ‘ ‘ or ” is draw nothing
And also we can use colors such as :
r: red, g: green,
b: blue, y: yellow .
If we want to add the map or chart key, we need first to import matplotlib.patches as mpatches then to add this line of code:
plt.legend([‘Male’,’Female’])
and the keys [‘Male’,’Female’] MUST be in the same sequence as the main plot code line :
plt.plot(data_yesrs,data_m,’r-‘, data_yesrs,data_f,’b–‘)

|
To Download my Python code (.py) files Click-Here
Taking pictures is not my main daily practices, but when i start playing with my camera, i really enjoy my self.
Thanks for visiting my Space..


