Python: Machine Learning – Part 2
Learning :Python and Machine Learning Part 2
Subject: Requirements, Sample and Implementation
Machine Learning Implementation : In the previous post (Click to Read: Python and Machine Learning Part 1) we start to learn about the ML Machine Learning and we use the sklearn model with Iris data-set. In this post we will generate our own data-set and tray to pass it to the ML model and find-out if the result are satisfying our needs.
First of all let’s talk about the data we want to collect, since we are doing tests and we can’t do anything on the accuracy checking part, I will select a very easy data so we can make sure that IF our ML-model select the right labels. So I will write a function to generate numbers (two pairs) positives and negatives to present the mouse location on the coordinate plane and the labels will be:
Up_r = Up Right, Up_l= Up Left,
D_r= Down Right, D_l= Down Left
So we have (4) classes 20 Instances in each, that’s 80 Instances in total.
The data will be passed into get_test_train_data() function, and it will return train, test data and labels, then we will train the model using the train_data() function, after that we will run the model on the test data to see if the model succeed in predicting the correct labels.
In this post I will cover the function that will generate the data and converting the data set into object data-set so we can use it in sklearn model without changing our code in part-1. I will use same data-set names as in sklearn Iris data-set.
Also we will write some information or say summary about the data we have and classes. So let’s see this part first..
   ## Data Set Characteristics :::
      Creator: Ali Radwani 26/11/2019

     Summary:
              This function will generate a dataset for Machine Learning for
              test and learning purpose. Numeric x,y represent the position
              of the mouse on the coordinate plane.
              Up_r = Up Right, Up_l= Up Left, D_r= Down Right, D_l= Down Left

     Number of Instances: 80 (20 in each of four (4) classes)
     Number of Attributes: 2 numeric (x,y), predictive attributes and the class.
     Attribute Information:
                 x (Position)
                 y (Position)
              class:
                 Up_r
                 Up_l
                 D_r
                 D_l
Once we create the data-set object we can append this information as description, adding descriptions to your data and applications is a good habit to learn and to have.
What is our data-set: From the summary part above we can see that we need to write a function to randomly generate two float number ranged from (-N) to (+N), N is our data_range. We assuming that these two numbers (pairs) are x, y of the mouse on the coordinate plane, so depending on each pairs (if it is negative or positive) we will add the corresponding class name, at the end we will have a list with tree values: x,y,label. Let’s see the code .
 # Function to generate data-set

  def data_set_generator():

      d_size = 400     # data-set size
      d_range = 200    # Data-set range
      data_list=[]
      nd1=[]

 # FOR loop to generate the random float numbers
      for x in range (d_size  ):
          nd1 =([round(random.uniform(-d_range,d_range),2),round(random.uniform(-d_range,d_range),2)])

 # Here we append the x,y pairs with labels.
          if nd1[0] > 0 and nd1[1] > 0 :
            data_list.append([nd1[0],nd1[1],'Up_r'])
          if nd1[0]  0 :
            data_list.append([nd1[0],nd1[1],'Up_l'])
          if nd1[0] > 0 and nd1[1] < 0 :
            data_list.append([nd1[0],nd1[1],'D_r'])
          if nd1[0] < 0 and nd1[1] < 0 :
            data_list.append([nd1[0],nd1[1],'D_l'])


 # We use shuffling the data-set to mix the data more
      for x in range (5):       # To mix the data
          random.shuffle(data_list)

      return data_list   # Return the data-set
 |
During writing the Machine Learning ML code to use Iris data-set, the data itself, the labels and other parts was called as an object from the main data-set. So here we need to create several sets of our data then we append them all to-gather. First I will split the data into two sets, one for the data and one for the targets(labels).
 # Function to prepare data-set

def dataset_prepare(the_dataset):
      '''
      input: dataset
      The function will split the dataset into 2 sets, one for data (data_set)
      and one for labels (target_set)

      '''
      target_set = []
      data_set = []

      for x in range (len(the_dataset)) :
          data_set.append([the_dataset[x][0],the_dataset[x][1]])
          target_set.append([the_dataset[x][2]])

       return data_set, target_set
prepare data set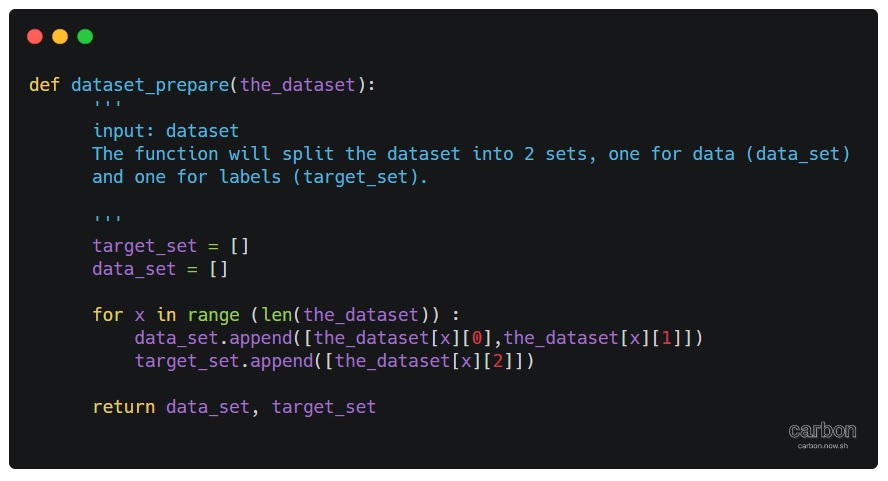
|
With above two functions we can now train our model and test it to see accuracy predictions. To make sure again that we can let our ML model to predict more new data-set, I create another function that will generate another set of data, I create this function to see try or say to be confident that YES the model is working. So let’s see the code. .
 # Function to create New dataset

def new_test_data():
    print( '\n\n====================================================' )
    print( '---------  START PREDICTION  for new data set ---------' )
    print( '\n  This is new data set, not the test one.. so there is ' )
    print( '  no labels to do comparing and to get the accuracy we ' )
    print( '  will use the IF loops.' )
    new_data_size = 5000    # data-set size
    new_data_range = 300   # data-set range
    print( '  The new data range is {}, and the new data size is {}.'.format( new_data_range, new_data_size ) )

    new_test_data1 = []
     # To generate the new data set.
    for x in range( new_data_size ):
        new_test_data1.append( [round( random.uniform( -new_data_range, new_data_range ), 2 ),
                                round( random.uniform( -new_data_range, new_data_range ), 2 )] )

    print( '\n\n  This is the prediction for the New Data set..\n' )

    prediction = clf.predict( new_test_data1 )
    cot = 0

    # Here we start counting the accuracy
    for i in range( len( prediction ) ):

        if prediction[i] == 'Up_r':
            if ((new_test_data1[i][0]) > 0 and (new_test_data1[i][1]) > 0):
                cot = cot + 1
        elif prediction[i] == 'Up_l':
            if ((new_test_data1[i][0])  0):
                cot = cot + 1
        elif prediction[i] == 'D_r':
            if ((new_test_data1[i][0]) > 0 and (new_test_data1[i][1]) < 0):
                cot = cot + 1
        elif prediction[i] == 'D_l':
            if ((new_test_data1[i][0]) < 0 and (new_test_data1[i][1]) < 0):
                cot = cot + 1

    print( '\n  We count {} correct prediction out of {} Instances.'.format( cot, (new_data_size) ) )
    print( '\n  The Accuracy is:', round( (cot / len( prediction )) * 100, 3 ), '%' )
Wrapping-up: In this post we wrote a function to generate a data-set and split it into two parts one for training and one for testing. Then we test the model with fresh new data-set that been generated via another function. Here is a screenshot of the final result.

|
To Download my Python code (.py) files Click-Here
 Follow me on Twitter..
-
December 3, 2019 at 9:47 amPython: Machine Learning – Part 3 | Ali's Photography Space...
Taking pictures is not my main daily practices, but when i start playing with my camera, i really enjoy my self.
Thanks for visiting my Space..


