Archive
Another Sketch Challenge: Giraffe
This week sketch challenge @1hour1sketch is to Draw a Giraffe, so here is my sketch using pencil, black Pen. More Sketches on my Sketch page ..

By: Ali Radwani.
Python: Data Visualization Part-2
Learning : python, pygal, Data Visualization,Line Chart
Subject: Data visualization using pygal library
In this post we will talk about Line-chart using pygal library in python, Line-chart has three sub-type as: Basic, Stacked ,Time. We will use the data-set for Average age of Males and Females at first Marage during 6 yeaars (2000 and 2006), the code line to set the data data will be as :
line_chart.add(‘Females’,[22,25,18,35,33,18])
line_chart.add(‘Males’, [30,20,23,31,39,44])
Line-chart: Basic
This is very normal and basic chart we use in all reports, we are feeding the data for Males and Females average age in first marage.. here is the code and the output ..
import pygal

line_chart = pygal.Line()

line_chart.add('Females',[22,25,18,35,33,18])
line_chart.add('Males', [30,20,23,31,39,44])

line_chart.x_labels=map(str,range(2000,2006))

line_chart.title = "Males and Females first Marage Age (average)"

line_chart.render()
 |
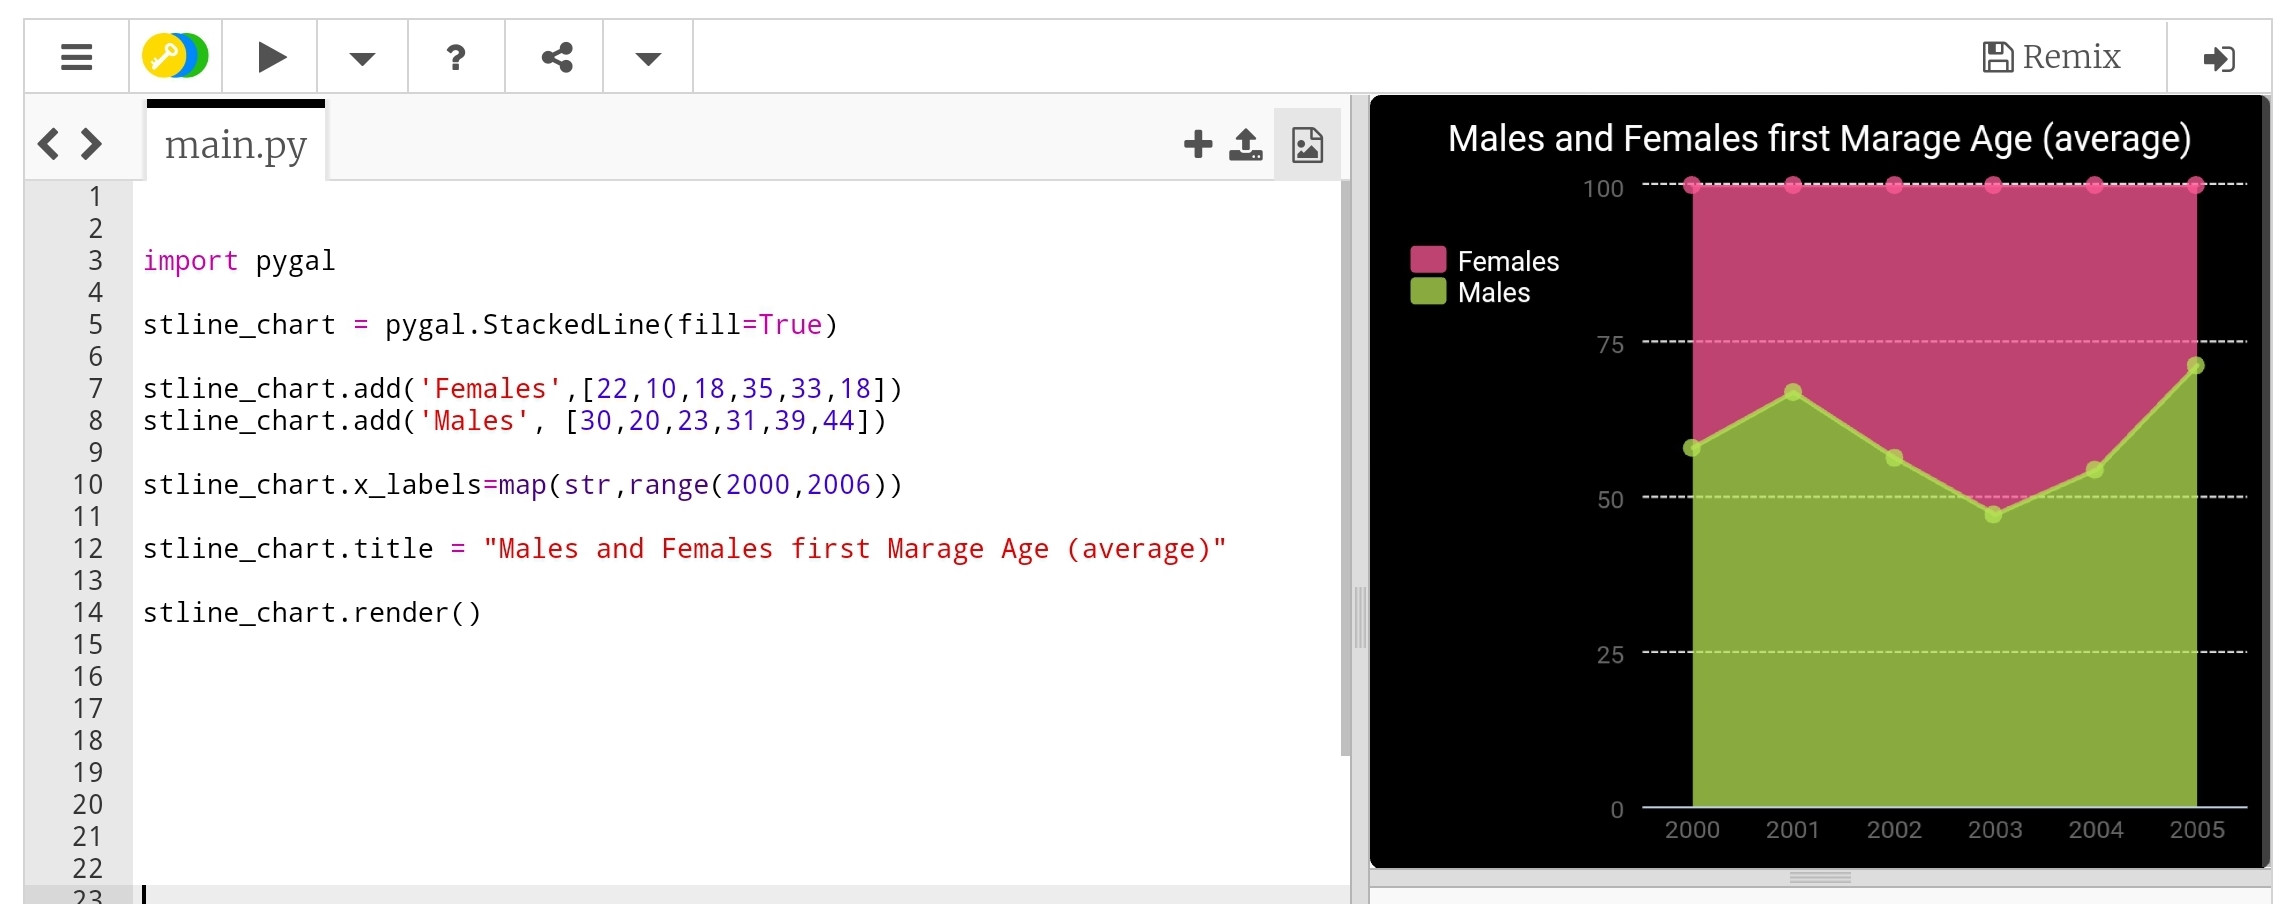
Line-chart: Stacked Line Stacked chart (fill) will put all the data in top of each other. Here is the code.
 |
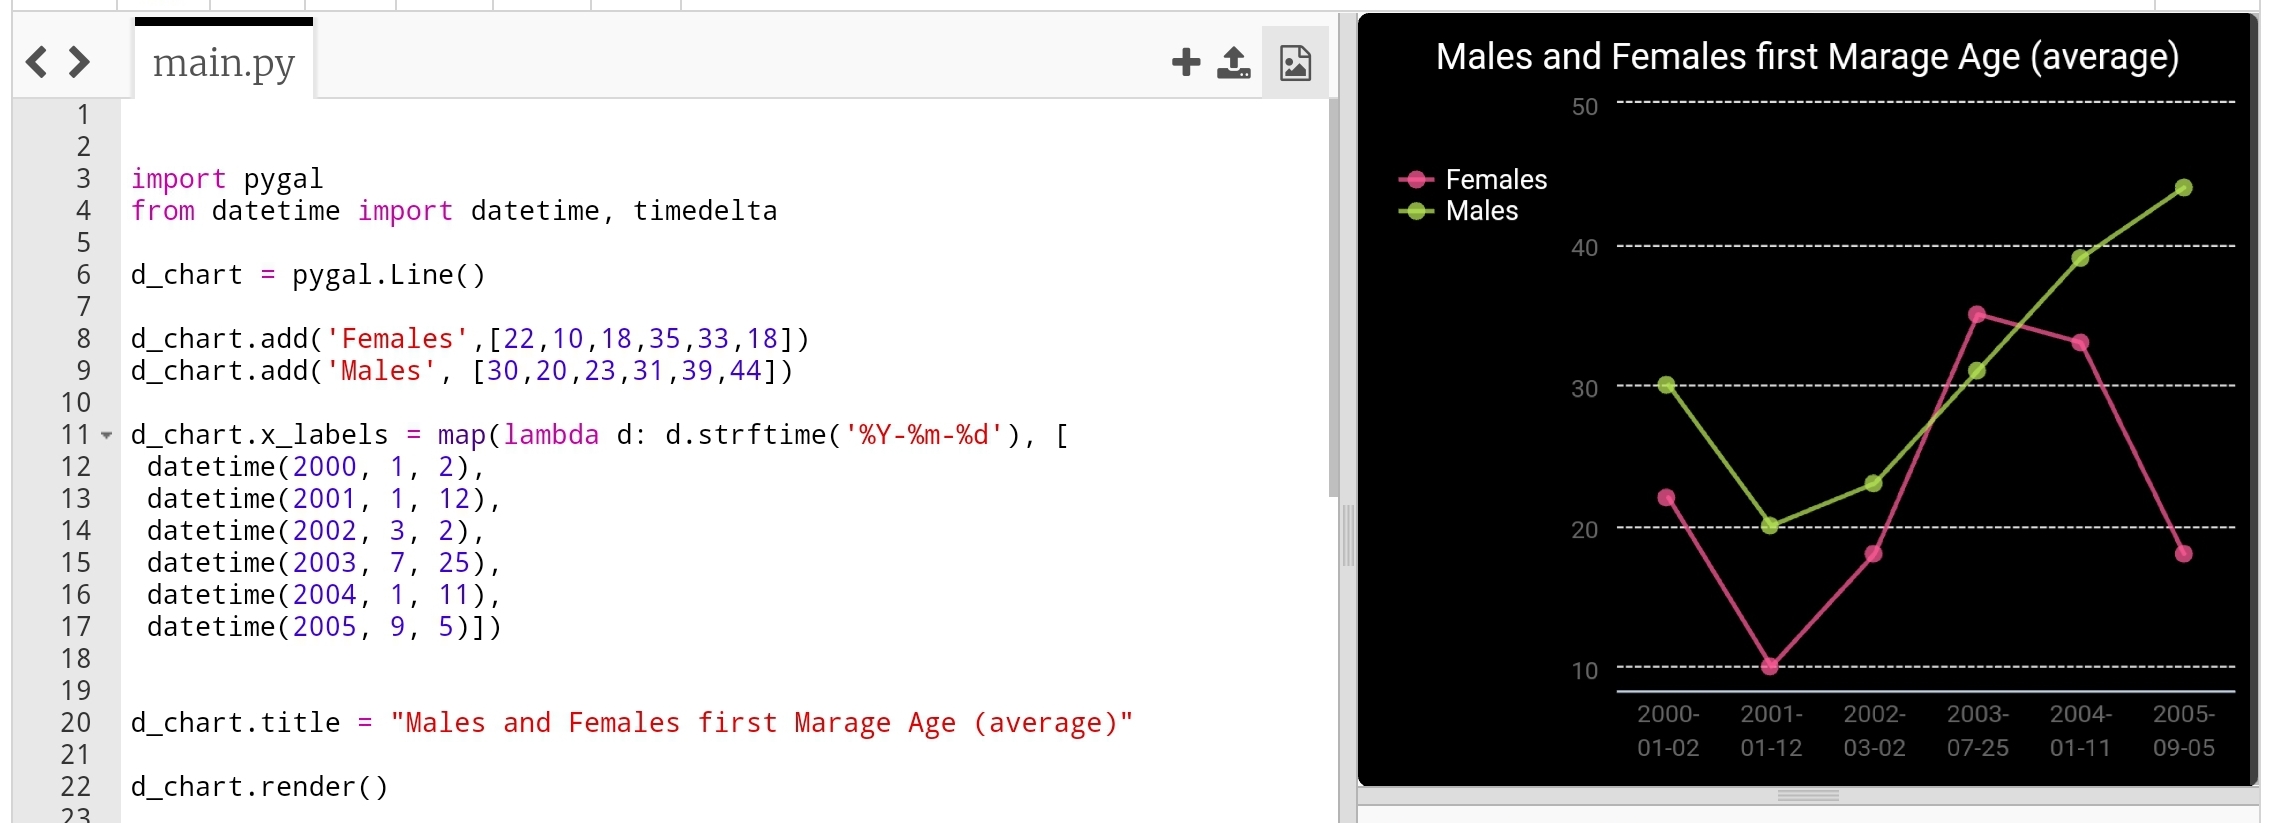
Line-chart: Time Line Last type just to add or format the x_lables of the chart, we can use lambda function to do this (we can use lambda function with any other chart types), here we will do two example, one is using full time/date and another just write the month-year as string and will use the lambda function to calculate second data-set of Tax’s based on the salary amount..
import pygal
from datetime import datetime, timedelta

d_chart = pygal.Line()

d_chart.add('Females',[22,25,18,35,33,18])
d_chart.add('Males', [30,20,23,31,39,44])

d_chart.x_labels = map(lambda d: d.strftime('%Y-%m-%d'), [
 datetime(2000, 1, 2),
 datetime(2001, 1, 12),
 datetime(2002, 3, 2),
 datetime(2003, 7, 25),
 datetime(2004, 1, 11),
 datetime(2005, 9, 5)])

d_chart.title = "Males and Females first Marage Age (average)"

d_chart.render()
 |
To give better example of using lambda function, we will say: we have a salaries for 6 years (May-2000 to May-2006) and a Tax of 0.25, we will let the lambda function to calculate the Tax amount for each salary. Here is the code ..
 # Using lambda to calculate Tax amount

import pygal

d_chart = pygal.Line()

d_chart.add('Salary', [550,980,1200,1800,2200,3500])

d_chart.add('Tax',map(lambda t: t*0.25, [550,980,1200,1800,2200,3500]))
d_chart.x_labels = map(str,(
  'May-2001','May-2002',
  'May-2003','May-2004',
  'May-2005','May-2006'))

d_chart.title = "Salary and Tax (0.25) payment in 6 years"

d_chart.render()
 |
Next we will talk about Histogram chart.
:: Data Visualization using pygal ::
| Part-1Bar-Chart | Part-2 Line Chart | Part-3 | Part-4 |
 Follow me on Twitter..
By: Ali Radwani
Python: Data Visualization Part-1
Learning : python, pygal, Data Visualization, Bar Chart
Subject: Data visualization using pygal library
pygal is a Data Visualization library in python to help us showing our Data as a graph. In coming several posts we will discover and learn how to use the pygal library in simple and easy configuration and style.
First we need to install pygal packeg, to do so write this:
pip install pygal
Now we need some Data to show, in this leson I am using aGalaxy Tab S4, so all the codes will be tested and applyed on trinket.io website [trinket.io alow us to use pygal package online so we don’t need to install it on our divice]
Type of Chart:
pygal has several types of charts that we can use, here we will list them all then in coming posts will use each one with simple data. So what we have:
Line, Bar, Histogram, XY, Pie, Radar, Box, Dot, Funnel, SolidGauge, Gauge, Pyramid, Treemap, Maps
Some of those charts has a sub-types such as in Bar char we have: Basic, Stacked and Horizontal. Also for each chart we can add a title and labels and we can use some styles.
So let’s start ..
First we will go for the Bar chart, and we have three sub-types as Basic, Stacked and Horizontal.
First chart: Bar chart:
In this part we will demonstrate the Bar Chart, it has three sub-types as Basic, Stacked and Horizontal.
We assume that our data is the Males and Female ages on first marage, the data will be as dictionary (later we will see how to customize each bar)
 # Basic Bar Chart using pygal

import pygal
bar_chart = pygal.Bar() # To create a bar graph object
bar_chart.add('Females', [22,25,18,35,33,18])
bar_chart.add('Males', [30,20,23,31,39,44])

bar_chart.title = "Males and Females First Marage Age"
bar_chart.x_labels=(range(1,6))

bar_chart.render()
Sample code for Basic bar chart |
Another sub-type in Bar chart is Horizontal-Bar, it is semelar to the Basic but as if fliped 90 degree. Here is the code ..
 # Horizontal Bar Chart using pygal

import pygal

# HorizontalBar()
HBar = pygal.HorizontalBar()
HBar.add('Females', [22,25,18,35,33,18])
HBar.add('Males', [30,20,23,31,39,44])

HBar.title = "Males and Females First Marage Age"

HBar.x_labels=(range(1,6))

HBar.render()
Sample code for Horizontal Bar chart |
Last sub-type in Bar chart is Stacked Bar were all data of each element will be in one bar. Here is the code and example..
 # Stacked Bar Chart using pygal

import pygal
# StackedBar()
stackedbar = pygal.StackedBar()
stackedbar.add('Females', [22,25,18,35,33,18])
stackedbar.add('Males', [30,20,23,31,39,44])
stackedbar.x_labels=(range(1,0))
stackedbar.title = "Males and Females First Marage Age"

stackedbar.render()
If we say we have another data-set as “age in First-Divorces” and we want to add this set to the Stacked Bar chart, then we first will create the data-set as:
stackedbar.add(‘Divorses’, [35,22,45,33,40,38])
and we will arrange the code line to be at top,middle or bottom of the bar. Here is the code..
Sample code for stacke Bar chart with Divorce data
|
Next we will talk about Line chart.
:: Data Visualization using pygal ::
| Part-1Bar-Chart | Part-2 | Part-3 | Part-4 |
By: Ali Radwani
Python: Password Generator
Learning : Python Project
Subject: Password Generator
In this function we will use the string library to select a random X numbers of letters as a Password length and print it on the screen.
First: We create a list of letters type l_type that hold the following: lowercase, uppercase, digits, punctuation and we will use the (random.choice) to select from the list.Then we will call the ‘password Generator’ pass_generator function torandomly select a letter based on the selected type, we will do so for a X time (X is the length of the password). In this project we will print the password on the screen, in real-life we can send the password via email or SMS. Here is the Code ..
# Password Generator Function

"""

Project: Python Password Generator
By: Ali Radwani
Date: Des-2020


    This function will use the string library to select a random X numbers of letters as a Password and print it on the screen.

    We create a list of letter type l_type that hold the following lowercase, uppercase, digits, punctuation and we will
    use the (random.choice) to select from the list, then we will call the 'password Generator' pass_generator function to
    randomly select a letter, we will do so for a X time (X is the length of the password). In this project we will print
    the password on the screen, in real-life we can send the password via email or SMS.

"""

import random, string

l_type = ["lowercase","uppercase","digits","punctuation"]

the_password =[]

def pass_generator(lt) :
    if lt =="lowercase":
        the_password.append(random.choice(string.ascii_lowercase))

    elif lt =="uppercase" :
        the_password.append(random.choice(string.ascii_uppercase))

    elif lt =="digits" :
        the_password.append(random.choice(string.digits))

    elif lt =="punctuation":
        the_password.append(random.choice(string.punctuation))

    return the_password


pass_length = int(input("\n   Enter the password Length: > "))


while len(the_password) < pass_length:
    pass_generator(random.choice(l_type))


print("\n   The New Generated Password is: ","".join(the_password))
To Download my Python code (.py) files Click-Here
By: Ali Radwani
Taking pictures is not my main daily practices, but when i start playing with my camera, i really enjoy my self.
Thanks for visiting my Space..


