Python: Data Visualization Part-2
Learning : python, pygal, Data Visualization,Line Chart
Subject: Data visualization using pygal library
In this post we will talk about Line-chart using pygal library in python, Line-chart has three sub-type as: Basic, Stacked ,Time. We will use the data-set for Average age of Males and Females at first Marage during 6 yeaars (2000 and 2006), the code line to set the data data will be as :
line_chart.add(‘Females’,[22,25,18,35,33,18])
line_chart.add(‘Males’, [30,20,23,31,39,44])
Line-chart: Basic
This is very normal and basic chart we use in all reports, we are feeding the data for Males and Females average age in first marage.. here is the code and the output ..
import pygal

line_chart = pygal.Line()

line_chart.add('Females',[22,25,18,35,33,18])
line_chart.add('Males', [30,20,23,31,39,44])

line_chart.x_labels=map(str,range(2000,2006))

line_chart.title = "Males and Females first Marage Age (average)"

line_chart.render()
 |
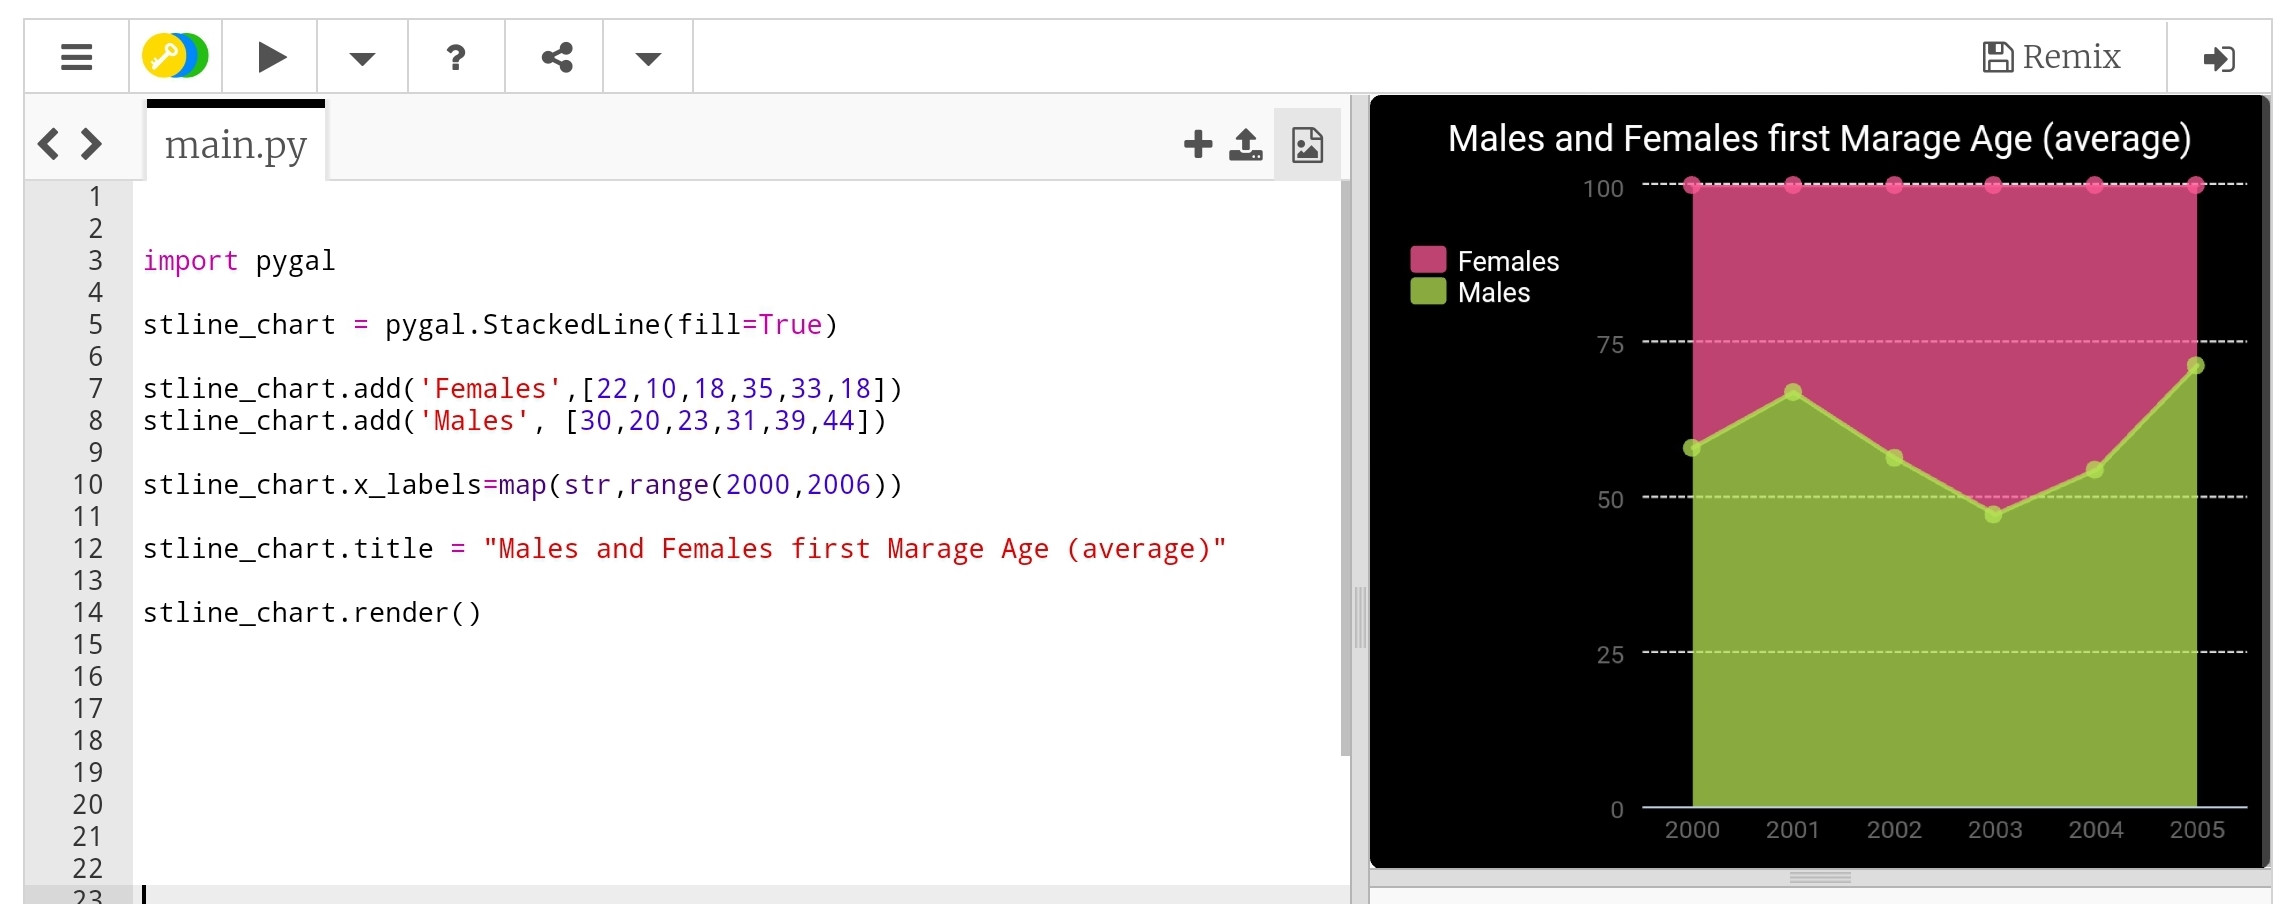
Line-chart: Stacked Line Stacked chart (fill) will put all the data in top of each other. Here is the code.
 |
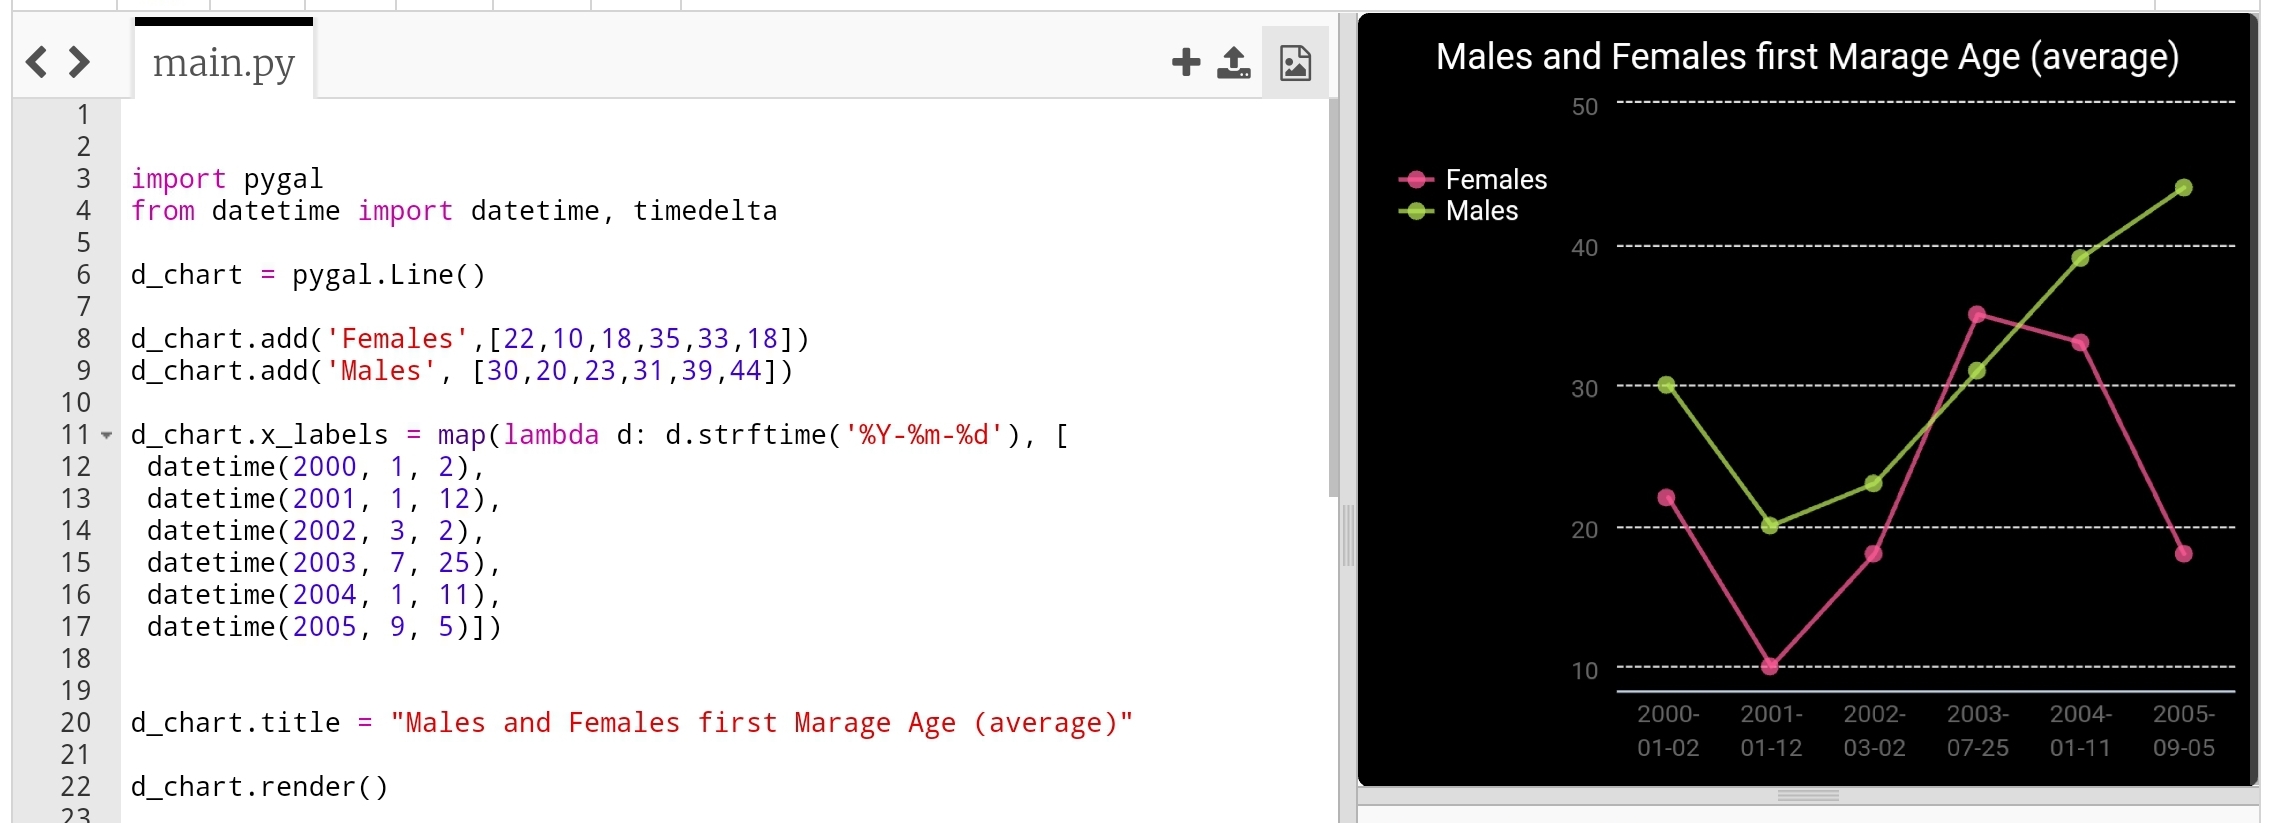
Line-chart: Time Line Last type just to add or format the x_lables of the chart, we can use lambda function to do this (we can use lambda function with any other chart types), here we will do two example, one is using full time/date and another just write the month-year as string and will use the lambda function to calculate second data-set of Tax’s based on the salary amount..
import pygal
from datetime import datetime, timedelta

d_chart = pygal.Line()

d_chart.add('Females',[22,25,18,35,33,18])
d_chart.add('Males', [30,20,23,31,39,44])

d_chart.x_labels = map(lambda d: d.strftime('%Y-%m-%d'), [
 datetime(2000, 1, 2),
 datetime(2001, 1, 12),
 datetime(2002, 3, 2),
 datetime(2003, 7, 25),
 datetime(2004, 1, 11),
 datetime(2005, 9, 5)])

d_chart.title = "Males and Females first Marage Age (average)"

d_chart.render()
 |
To give better example of using lambda function, we will say: we have a salaries for 6 years (May-2000 to May-2006) and a Tax of 0.25, we will let the lambda function to calculate the Tax amount for each salary. Here is the code ..
 # Using lambda to calculate Tax amount

import pygal

d_chart = pygal.Line()

d_chart.add('Salary', [550,980,1200,1800,2200,3500])

d_chart.add('Tax',map(lambda t: t*0.25, [550,980,1200,1800,2200,3500]))
d_chart.x_labels = map(str,(
  'May-2001','May-2002',
  'May-2003','May-2004',
  'May-2005','May-2006'))

d_chart.title = "Salary and Tax (0.25) payment in 6 years"

d_chart.render()
 |
Next we will talk about Histogram chart.
:: Data Visualization using pygal ::
| Part-1Bar-Chart | Part-2 Line Chart | Part-3 | Part-4 |
 Follow me on Twitter..
By: Ali Radwani
Taking pictures is not my main daily practices, but when i start playing with my camera, i really enjoy my self.
Thanks for visiting my Space..


