Archive
Python: My Fake Data Generator P-3
Learning : Python: Functions, Procedures and documentation
Subject: About fake data P-3: (Fake Time)
The third function of our Fake Data Generator will be the Time function, Fake Time is very easy to implement, all we need is call random function two times, one for minutes (0,60) and another for hours (0,12 or 0,23) based on the argument s (style).
Let’s start: First we need to Import random, the function def ftime() will take one integer argument (s) represent the time style.
If the s = 12 then the time format will be regular start from 1 and end at 12, the number will be generated randomly using random.randint, also we will select random.choice([‘ AM’,’ PM’]) to be added to the time and return it back.
If the s = 24 or nothing been passed then the time format will start from 0 to 23 (Military Time Format). Another random integer (0,60) to be generated as minutes.
'''
  Fake Data Generator
  Function for:  Fake Time
  Ali Radwani
  11/12/2019
'''

import random

def ftime(s = 24):

    """
        ###   Fake Time Generator   ###
        Date: 11.12.2019, By: Ali Radwani

        This function will generate a fake time, the
        function accept one int argument s.

        If s = 12 function return Regular time format,
        If s = 24 function return military time format
        (the 24 format system).

        If No argument passes then default time system
        format will be 24 system (military time)

        Argument: int : s, if No argument then default is 24.

        Return: str : ftimes
    """

    m = str(random.randint(0,60))
    if (len(m)) == 1 :
            m = '0' + str (m)

    if s == 12 :
        h = str(random.randint(1,12))
        if (len(h)) == 1:
            h = '0' + h
    else :
        h = str(random.randint(0,23))
        if (len(h)) == 1:
            h = '0' + h

    ftimes = str(h) + ':' + str(m)
    if s == 12 :
        ftimes = ftimes + random.choice([' AM',' PM'])

    return ftimes

# Testing the function.
for x in range (10):
    print (ftime(12))
:: Fake Function List ::
| Function Name | Description |
| Color | To return a random color code in RGB or Hex. |
| Date | To return a random date. |
| Mobile | To return a mobile number. |
| Country | To return a random country name. |
| City | To return a random City name. |
| ID | To return X random dig as ID. |
| Time | To return random time. |
| Car’s Brand | |
| Foods | |
| Done |
 Follow me on Twitter..
By: Ali Radwani
Python: My Fake Data Generator P-2
Learning : Python: Functions, Procedures and documentation
Subject: About fake data P-2: (Fake ID)
Before we start i’d like to mention that with our last fcolor() function we write some comments in the first part of the function between three double quote(“””), and if we load the function and call help() as help(fcolor()) we will get that information on the python console as a help as in screen shot.

|
In this post we will write a function to generate a fake ID number, for ID’s there could be several styles, sometime we just want a random number without any meaning; just X number of random digits. Most of the time we need this number to be mean-full based on certain rules. For example, in Banks they may use some digits that indicate the branch. In sport club, they may include the date … and so-on.
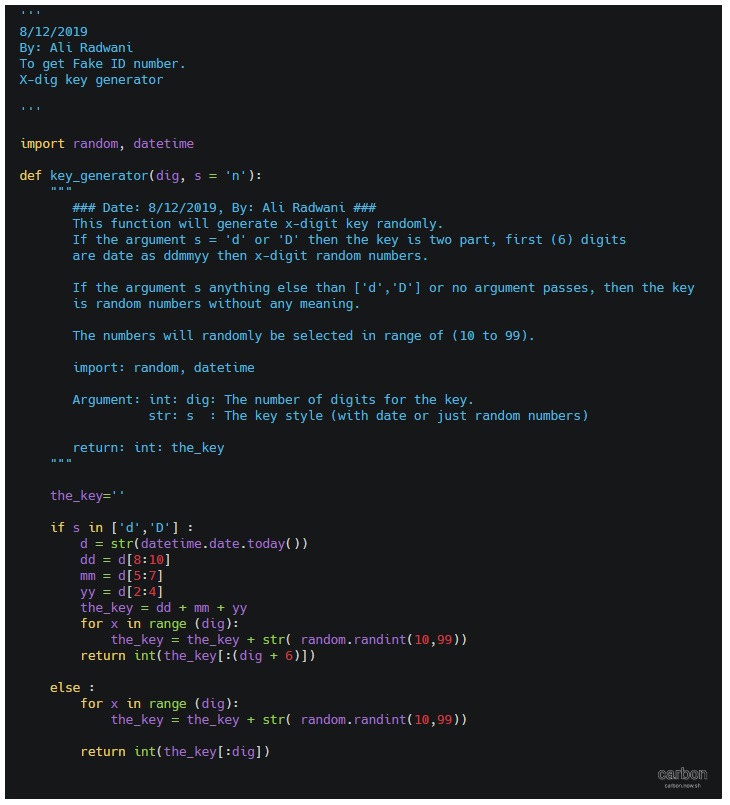
Here we will write a function called key_generator(), the function will take two arguments (dig, s) dig is your key digits number, s is the style, if s = d then the first 6 digits of the key will be the date as ddmmyy + random digits, and if s = anything else or s not passed then the key will be as default (just x-digits). Let’s see the code.
First the summary or say information about the function:
def key_generator(dig, s = 'n'):
    """
       ### Date: 8/12/2019, By: Ali Radwani ###
       Summary:
            This function will generate x-digit key randomly.
            If the argument s = 'd' or 'D' then the key is two part, first (6) digits
            are date as ddmmyy then x-digit random numbers.

            If the argument s anything else than ['d','D'] or no argument passes, then the key
            is random numbers without any meaning.

            The numbers will randomly be selected in range of (10 to 99).

            import: random, datetime

            Argument: int: dig: The number of digits for the key.
                 str: s  : The key style (with date or just random numbers)

            return: int: the_key
    """
Now, if the user pass s=’d’ then part of the key will be the current date, to do this we will call the datetime function in python and split it into dd,mm,yy. Here is the key_generator() function.
def key_generator(dig, s = 'n'):
    """
       ### Date: 8/12/2019, By: Ali Radwani ###
       Summary:
            This function will generate x-digit key randomly.
            If the argument s = 'd' or 'D' then the key is two part, first (6) digits
            are date as ddmmyy then x-digit random numbers.

            If the argument s anything else than ['d','D'] or no argument passes, then the key
            is random numbers without any meaning.

            The numbers will randomly be selected in range of (10 to 99).

            import: random, datetime

            Argument: int: dig: The number of digits for the key.
                 str: s  : The key style (with date or just random numbers)

            return: int: the_key
    """
    the_key=''
    if s in ['d','D'] :
        d = str(datetime.date.today())
        dd = d[8:10]
        mm = d[5:7]
        yy = d[2:4]
        the_key = dd + mm + yy
        for x in range (dig):
            the_key = the_key + str( random.randint(10,99))
        return int(the_key[:(dig + 6)])

    else :
        for x in range (dig):
            the_key = the_key + str( random.randint(10,99))

        return int(the_key[:dig])
|
In next Fake Data function we will try to write one to generate the date. It will be published on next Sunday.
:: Fake Function List ::
| Function Name | Description |
| Color | To return a random color code in RGB or Hex. |
| Date | To return a random date. |
| Mobile | To return a mobile number. |
| Country | To return a random country name. |
| City | To return a random City name. |
| ID | To return X random dig as ID. |
| Time | To return random time. |
| Done |
By: Ali Radwani
python: Fake Data-set
Learning : Python to generate fake data-set
Subject: About Fake data library
Most of the time when we working on a project, we need to test our procedures and functions with some data. In most cases we need just dummy data such as dates, names, address .. and so-on.
Last week, I was reading on the net and i fond an article about generating fake data using a library in PHP (PHP is a Computer Programming Language) so I start to find if we have one in Python! and the answer is YES there is a library that we can import called ‘Fake’. I start to work on it and discover it. This post is about the Fake Data-set Library.
The library called ‘Faker’ and we need to install it in our python environment, i use : pip install Faker to install it. In it’s documentation we can use some properties like : name, city, date, job .. and others. So if we want to generate a fake name we write this:
# Using lib:fake to generate fake name

print(fake.name())
[Output]: Victoria Campbell
Here is a screen-shot from Jupyter notbook screen.

|
To generate more than one name we can use for loop as:
# Using lib:fake to generate (X) fake name

for x in range (10) :
    print(fake.name())
[Output]: Jared Hawkins
Michael Reid
Ricky Brown
Mary Tyler
Kristy Dudley
Karen Cain
Jennifer Underwood
Desiree Jensen
Carla Rivera
Brandon Cooper
Other properties that we can use are :address, company, job, country, date_time and many other, and with all this we can create a data-set full of fake data.
So if we want to create a fake data-set contain:
Name, Date-of-birth, Company, Job, Country as one person data we will use it like this:
# Using lib:fake to generate (X) person fake data
# Data-set contain: Name, Date-of-birth, Company, Job, Country
p_count = 1
for x in range (p_count):
    print('Name:',fake.name())
    print('DOB:',fake.date())
    print('Company:',fake.company())
    print('Job:',fake.job())
    print('country:',fake.country())


[Output]:
Name: Crystal Mcconnell
DOB: 2002-09-30
Company: Bailey LLC
Job: Insurance underwriter
country: Pakistan

|
Now if we want to store the person data in a dictionary type variable and use it later, we can do this as following:
# Using lib:fake to generate (X) person fake data and store it in a dictionary
people_d ={}
p_count = 5
for x in range (p_count):
    ID = x
    people_d[ID]={'name':fake.name(),'date':fake.date(),'company':fake.company(),'job':fake.job(),'country':fake.country()}

# To print-out the people_d data-set.
for x in people_d :
    print(people_d[x])
Just in case we want a complicated ID we can use a random function (8-dig) integer, or combining two fake numbers such as (fake.zipcode() and fake.postcode()) just to make sure that we will not have a duplicate ID.
Using fake library will help a lot, and it has many attributes and properties that can be inserted in a data-set. For more information on this document you may read it here: Fake Library
To Download my Python code (.py) files Click-Here
By: Ali Radwani
Python: Machine Learning – Part 2
Learning :Python and Machine Learning Part 2
Subject: Requirements, Sample and Implementation
Machine Learning Implementation : In the previous post (Click to Read: Python and Machine Learning Part 1) we start to learn about the ML Machine Learning and we use the sklearn model with Iris data-set. In this post we will generate our own data-set and tray to pass it to the ML model and find-out if the result are satisfying our needs.
First of all let’s talk about the data we want to collect, since we are doing tests and we can’t do anything on the accuracy checking part, I will select a very easy data so we can make sure that IF our ML-model select the right labels. So I will write a function to generate numbers (two pairs) positives and negatives to present the mouse location on the coordinate plane and the labels will be:
Up_r = Up Right, Up_l= Up Left,
D_r= Down Right, D_l= Down Left
So we have (4) classes 20 Instances in each, that’s 80 Instances in total.
The data will be passed into get_test_train_data() function, and it will return train, test data and labels, then we will train the model using the train_data() function, after that we will run the model on the test data to see if the model succeed in predicting the correct labels.
In this post I will cover the function that will generate the data and converting the data set into object data-set so we can use it in sklearn model without changing our code in part-1. I will use same data-set names as in sklearn Iris data-set.
Also we will write some information or say summary about the data we have and classes. So let’s see this part first..
   ## Data Set Characteristics :::
      Creator: Ali Radwani 26/11/2019

     Summary:
              This function will generate a dataset for Machine Learning for
              test and learning purpose. Numeric x,y represent the position
              of the mouse on the coordinate plane.
              Up_r = Up Right, Up_l= Up Left, D_r= Down Right, D_l= Down Left

     Number of Instances: 80 (20 in each of four (4) classes)
     Number of Attributes: 2 numeric (x,y), predictive attributes and the class.
     Attribute Information:
                 x (Position)
                 y (Position)
              class:
                 Up_r
                 Up_l
                 D_r
                 D_l
Once we create the data-set object we can append this information as description, adding descriptions to your data and applications is a good habit to learn and to have.
What is our data-set: From the summary part above we can see that we need to write a function to randomly generate two float number ranged from (-N) to (+N), N is our data_range. We assuming that these two numbers (pairs) are x, y of the mouse on the coordinate plane, so depending on each pairs (if it is negative or positive) we will add the corresponding class name, at the end we will have a list with tree values: x,y,label. Let’s see the code .
 # Function to generate data-set

  def data_set_generator():

      d_size = 400     # data-set size
      d_range = 200    # Data-set range
      data_list=[]
      nd1=[]

 # FOR loop to generate the random float numbers
      for x in range (d_size  ):
          nd1 =([round(random.uniform(-d_range,d_range),2),round(random.uniform(-d_range,d_range),2)])

 # Here we append the x,y pairs with labels.
          if nd1[0] > 0 and nd1[1] > 0 :
            data_list.append([nd1[0],nd1[1],'Up_r'])
          if nd1[0]  0 :
            data_list.append([nd1[0],nd1[1],'Up_l'])
          if nd1[0] > 0 and nd1[1] < 0 :
            data_list.append([nd1[0],nd1[1],'D_r'])
          if nd1[0] < 0 and nd1[1] < 0 :
            data_list.append([nd1[0],nd1[1],'D_l'])


 # We use shuffling the data-set to mix the data more
      for x in range (5):       # To mix the data
          random.shuffle(data_list)

      return data_list   # Return the data-set
 |
During writing the Machine Learning ML code to use Iris data-set, the data itself, the labels and other parts was called as an object from the main data-set. So here we need to create several sets of our data then we append them all to-gather. First I will split the data into two sets, one for the data and one for the targets(labels).
 # Function to prepare data-set

def dataset_prepare(the_dataset):
      '''
      input: dataset
      The function will split the dataset into 2 sets, one for data (data_set)
      and one for labels (target_set)

      '''
      target_set = []
      data_set = []

      for x in range (len(the_dataset)) :
          data_set.append([the_dataset[x][0],the_dataset[x][1]])
          target_set.append([the_dataset[x][2]])

       return data_set, target_set
prepare data set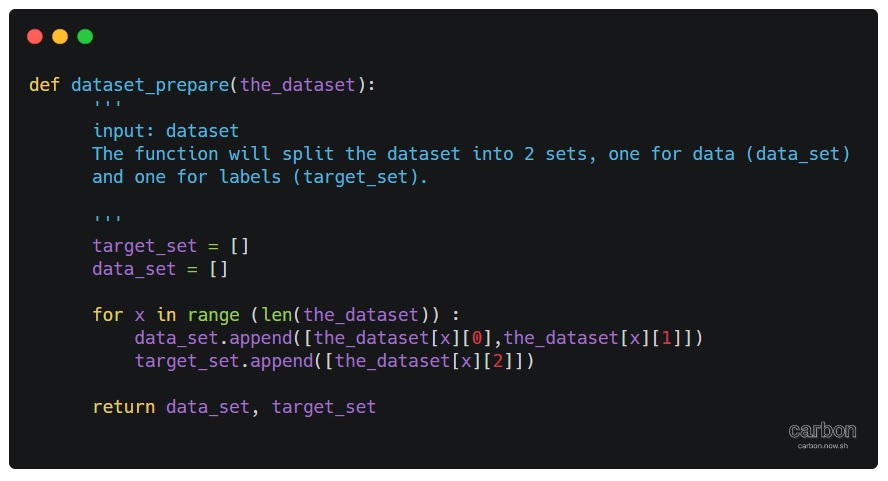
|
With above two functions we can now train our model and test it to see accuracy predictions. To make sure again that we can let our ML model to predict more new data-set, I create another function that will generate another set of data, I create this function to see try or say to be confident that YES the model is working. So let’s see the code. .
 # Function to create New dataset

def new_test_data():
    print( '\n\n====================================================' )
    print( '---------  START PREDICTION  for new data set ---------' )
    print( '\n  This is new data set, not the test one.. so there is ' )
    print( '  no labels to do comparing and to get the accuracy we ' )
    print( '  will use the IF loops.' )
    new_data_size = 5000    # data-set size
    new_data_range = 300   # data-set range
    print( '  The new data range is {}, and the new data size is {}.'.format( new_data_range, new_data_size ) )

    new_test_data1 = []
     # To generate the new data set.
    for x in range( new_data_size ):
        new_test_data1.append( [round( random.uniform( -new_data_range, new_data_range ), 2 ),
                                round( random.uniform( -new_data_range, new_data_range ), 2 )] )

    print( '\n\n  This is the prediction for the New Data set..\n' )

    prediction = clf.predict( new_test_data1 )
    cot = 0

    # Here we start counting the accuracy
    for i in range( len( prediction ) ):

        if prediction[i] == 'Up_r':
            if ((new_test_data1[i][0]) > 0 and (new_test_data1[i][1]) > 0):
                cot = cot + 1
        elif prediction[i] == 'Up_l':
            if ((new_test_data1[i][0])  0):
                cot = cot + 1
        elif prediction[i] == 'D_r':
            if ((new_test_data1[i][0]) > 0 and (new_test_data1[i][1]) < 0):
                cot = cot + 1
        elif prediction[i] == 'D_l':
            if ((new_test_data1[i][0]) < 0 and (new_test_data1[i][1]) < 0):
                cot = cot + 1

    print( '\n  We count {} correct prediction out of {} Instances.'.format( cot, (new_data_size) ) )
    print( '\n  The Accuracy is:', round( (cot / len( prediction )) * 100, 3 ), '%' )
Wrapping-up: In this post we wrote a function to generate a data-set and split it into two parts one for training and one for testing. Then we test the model with fresh new data-set that been generated via another function. Here is a screenshot of the final result.

|
To Download my Python code (.py) files Click-Here
Python ploting
Learning : Plotting Data using python and numpy
Subject: Plotting Data
The best way to show the data is to make them as a graph or charts, there are several charts type and names each will present your data in a different way and used for different purpose. Plotting the data using python is a good way to show out your data and in coming posts we will cover very basic aspects in plotting data. So if we just want to show a sample for what we are talking about, we will say: we have a sample of hospital data for born childs (male m, female f, in years 200 to 2003).
:: Click to enlarge :: 
|
There are some libraries we can use in python to help us plotting the data, here are some of them. Matplotlib, Plotly and Seaborn are just samples of what we may use, in this post we will use the Matplotlib. To use Matplotlib we need to install it, so if it is not installed in your python you need to do so.
pip install Matplotlib
Then we need to import it in our code using :
import matplotlib.pyplot as plt
To show the data we need to have some variables that will be used in our first example, So the case is that we have some data from a hospital, the data are numbers of born childs (male m, female f) in years 2000 to 2003. We will store/save the data in list, we will have data_yesrs =[2000,2001,2002,2003], then we will have male born data in data_m=[2,2.5,3,5] and female born data data_f = [3,3.8,4,4.5], the chart will have two axis vertical is Y y_data_title =’In Hundreds’ and horizontal is X x_data_title =’ Years’, now to project all this information on a chart we use this code ..
import matplotlib.pyplot as plt
data_yesrs = [2000,2001,2002,2003] # years on X axis
data_m = [2,2.5,3,5]   # y data males born
data_f = [3,3.8,4,4.5]  # y data female born
y_data_title ='In Thousands'
x_data_title =' Years'

plt.title('New Born babies')

plt.plot(data_yesrs,data_m,'r-', data_yesrs,data_f,'b--')
plt.ylabel(y_data_title)
plt.xlabel(x_data_title)
plt.show()
Another way to plot the data were we can use a one line for each data set as:
plt.plot(data_x,data_m,’r-‘)
plt.plot(data_x,data_f,’b–‘)
We can see that male data is red line, and female data is blue dashes, we can use some line style to present the data as mentioned bellow:
‘-‘ or ‘solid’ is solid line
‘–‘ or ‘dashed’ is dashed line
‘-.’ or ‘dashdot’ is dash-dotted line
‘:’ or ‘dotted’ is dotted line
‘None’ or ‘ ‘ or ” is draw nothing
And also we can use colors such as :
r: red, g: green,
b: blue, y: yellow .
If we want to add the map or chart key, we need first to import matplotlib.patches as mpatches then to add this line of code:
plt.legend([‘Male’,’Female’])
and the keys [‘Male’,’Female’] MUST be in the same sequence as the main plot code line :
plt.plot(data_yesrs,data_m,’r-‘, data_yesrs,data_f,’b–‘)

|
To Download my Python code (.py) files Click-Here
Python: Circle Packing
Circle Packing Project
Subject: Draw, circles, Turtle
Definition: In geometry, circle packing is the study of the arrangement of circles on a given surface such that no overlapping occurs and so that all circles touch one another. Wikipedia
So, we have a canvas size (w,h) and we want to write a code to draw X number of circles in this area without any overlapping or intersecting between circles. We will write some functions to do this task, thous functions are:
1. c_draw (x1,y1,di): This function will take three arguments x1,y1 for circle position and di as circle diameter.
2. draw_fram(): This function will draw the frame on the screen, we set the frame_w and frame_h as variables in the setup area in the code.
3. c_generator (max_di): c_generator is the circles generating function, and takes one argument max_di presenting the maximum circles diameter. To generate a circle we will generate three random numbers for x position, y position and for circle diameter (max_di is the upper limit),also with each generating a while loop will make sure that the circle is inside the frame, if not regenerate another one.
4. can_we_draw_it (q1,di1): This is very important, to make sure that the circle is not overlapping with any other we need to use a function call (hypot) from math library hypot return the distance between two points, then if the distance between two circles is less than the total of there diameters then the two circles are not overlaps.

|
So, lets start coding …
First: the import and setup variables:
from turtle import *
import random
import math

# Create a turtle named t:
t =Turtle()
t.speed(0)
t.hideturtle()
t.setheading(0)
t.pensize(0.5)
t.penup()

# frame size
frame_w = 500
frame_h = 600

di_list = [] # To hold the circles x,y and diameters
 |
Now, Drawing the frame function:
def draw_fram () :t.penup()
t.setheading(0)
t.goto(-frame_w/2,frame_h/2)
t.pendown()
t.forward(frame_w)
t.right(90)
t.forward(frame_h)
t.right(90)
t.forward(frame_w)
t.right(90)
t.forward(frame_h)
t.penup()
t.goto(0,0)
Now, Draw circle function:
def c_draw (x1,y1,di):t.goto(x1,y1)
t.setheading(-90)
t.pendown()
t.circle(di)
t.penup()
This is Circles generator, we randomly select x,y and diameter then checks if it is in or out the canvas.
def c_generator (max_di):falls_out_frame = True
while falls_out_frame :
x1 = random.randint(-(frame_w/2),(frame_w/2))
y1 = random.randint(-(frame_h/2),(frame_h/2))
di = random.randint(3,max_di)
# if true circle is in canvas
if (x1-di > ((frame_w/2)*-1)) and (x1-di < ((frame_w/2)-(di*2))) :
if (y1 ((frame_h/2)-(di))*-1) :
falls_out_frame = False
di_list.append([x1-di,y1,di])

|
With each new circle we need to check the distances and the diameter between new circle and all circles we have in the list, if there is an overlap then we delete the new circle data (using di_list.pop()) and generate a new circle. So to get the distances and sum of diameters we use this code ..
 # get circles distance

    cs_dis = math.hypot(((last_cx + last_cdi) - (c_n_list_x + c_n_list_di)) , (last_cy - c_n_list_y))
    di_total = last_cdi + c_n_list_di
To speed up the generation of right size of circles I use a method of counting the trying times of wrong sizes, that’s mean if the circles is not fit, and we pop it’s details from the circles list we count pops, if we reach certain number then we reduce the upper limits of random diameter of the new circles we generate. Say we start with max_di = 200, then if we pop for a number that divide by 30 (pop%30) then we reduce the max_di with (-1) and if we reach max_di less then 10 then max_di = 60. and we keep doing this until we draw 700 circles.
# if di_list pops x time then we reduce the randomization upper limits
  if (total_pop % 30) == 0:
    max_di = max_di - 1
    if max_di < 10 :
      max_di = 60
Here are some output circles packing ..
 |
 |
With current output we reach the goal we are looking for, although there is some empty spaces, but if we increase the number of circles then there will be more time finding those area with random (x,y,di) generator, I am thinking in another version of this code that’s will cover:
1. Coloring the circles based on the diameter size.
2. A method to fill the spaces.
To Download my Python code (.py) files Click-Here
Python: Numpay – P3
Learning : Python Numpy – P3
Subject: numpy array and some basic commands
The numpy lessons and basic commands will take us to plotting the data and presenting the numbers using the numpy and plot packages, but first we need to do more practices on arrays and functions in the numpy.
To get a row or a column from the array we use:
# Generate a 5x5 random array:
ar = np.random.randint(10,60, size=(5,5))
print('\n A random generated array 5x5 is: \n',ar)

# get the rows from 1 to 3 (rows 1 and 2):
print('\n  The rows from 1 to 3 is: \n',ar[1:3])

# get row 1 and row 3:
print('\n  The row 1 and row 2 is: \n',ar[1],ar[3])

# get the column 1 and column 3:
print('\n  The column 1 and column 3: \n',ar[:,[1,3]])

[Output]:
A random generated array 5x5 is:
 [[59 43 46 44 39]
 [16 15 14 19 22]
 [59 16 33 59 19]
 [21 15 51 41 28]
 [48 46 58 33 19]]

The rows from 1 to 3 is:
[[16 15 14 19 22]
 [59 16 33 59 19]]

The row 1 and row 2 is:
[16 15 14 19 22]
[21 15 51 41 28]

The column 1 and column 3:
 [[43 44]
 [15 19]
 [16 59]
 [15 41]
 [46 33]]
To change a value in the array we give the position and new value as:
# Generate a 5x5 random array:
ar = np.random.randint(10,60, size=(5,5))
print('\n A random generated array 5x5 is: \n',ar)
print('\n Value in position (1,1):',ar[1][1])
# Re-set the value in position (1,1) to 55
ar[1][1] = 55
print('\n The array ar\n',ar)

code
[Output]:

A random generated array 5x5 is:
 [[39 53 34 59 30]
 [33 10 42 20 36]
 [10 37 20 35 28]
 [26 18 14 41 24]
 [48 22 19 18 44]]

 Value in position (1,1): 10

 The array ar
 [[39 53 34 59 30]
 [33 55 42 20 36]
 [10 37 20 35 28]
 [26 18 14 41 24]
 [48 22 19 18 44]]
If we have a one dimension array with values, and we want to create another array with values after applying a certain conditions, such as all values grater than 7.
# Create 1D array of range 10
ar = np.arange(10)
print(ar)

# ar_g7 is a sub array from ar of values grater then 7
ar_g7= np.where(ar >7)
print('ar_g7:'ar_g7)


[Output]:
[0 1 2 3 4 5 6 7 8 9]
ar_g7:(array([8, 9]),)
If we want to pass a 3×3 array and then we want the values to be changed to (1) if it is grater than 7 and to be (0) if it is less than 7.
# Generate a 3x3 array of random numbers.
ar2 = np.random.randint(1,10, size =(3,3))
print(ar2)

# Change any value grater than 7 to 1 and if less than 7 to 0.
ar_g7= np.where(ar2 >7, 1 ,0)
print('ar_g7:',ar_g7)

[Output]:
[[6 4 2]
 [8 5 1]
 [5 2 8]]

ar_g7:
[[0 0 0]
 [1 0 0]
 [0 0 1]]
Also we can say if, the value in the array is equal to 6 or 8 then change it to -1.
# Generate array of 3x3
ar2 = np.random.randint(1,10, size =(3,3))
print(ar2)


# If the = 6 or 8 change it to (-1)
ar_get_6_8_value= np.where((ar2 == 6) |( ar2==8), -1 ,ar2)
print('ar_get_6_8_value:',ar_get_6_8_value)

[Output]:
[[3 4 8]
 [1 9 3]
 [5 6 6]]

ar_get_6_8_value:
[[ 3  4 -1]
[ 1  9  3]
[ 5 -1 -1]]
We can get the index location of the certain conditions values, and then we can print it out.
# # Generate array of 3x3

ar_less_6= np.where((ar2 < 6) )
print('ar_less_6 locations:',ar_less_6)

# print out the values on those locations.
print('ar_less_6 values: ',ar2[ar_less_6])
[Output]:
[[6 1 9]
 [1 8 6]
 [6 9 2]]

ar_less_6 locations: (array([0, 1, 2]), array([1, 0, 2]))
ar_less_6 values :[1 1 2]
:: numpy Sessions ::
| Sessions 1 | Sessions 2 | Sessions 3 | Sessions 4 |
To Download my Python code (.py) files Click-Here
Python and Lindenmayer System – P2
Learning : Lindenmayer System P2
Subject: Drawing with python using L-System
In the first part of Lindenmayer System L-System post (Click to Read) we had wrote two functions: one to generate the pattern based on the variables and roles, and one to draw lines and rotate based on the pattern we have.
In this part I will post images of what Art we can generate from L-System
the codes will be the L-system that generate the patterns, so the code will include: the Rules, Angle (Right, Left) Iteration and Starting Variable.
 |
L-System: Koch Curve  |
L-System: Minkowski Sausage |
L-System: … but here the Iteration is: 3 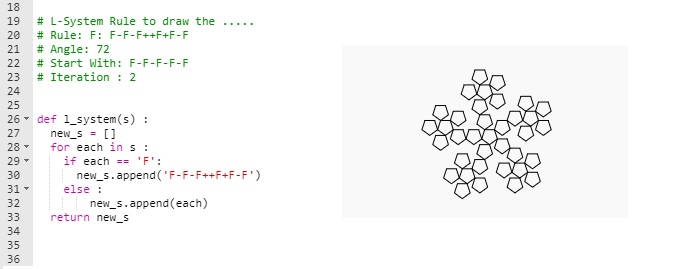 |
L-System: Again … but here the Iteration is: 3  |
L-System: Square Sierpinski  |
L-System: Sierpinski Arrowhead.  |
L-system: Dragon Curve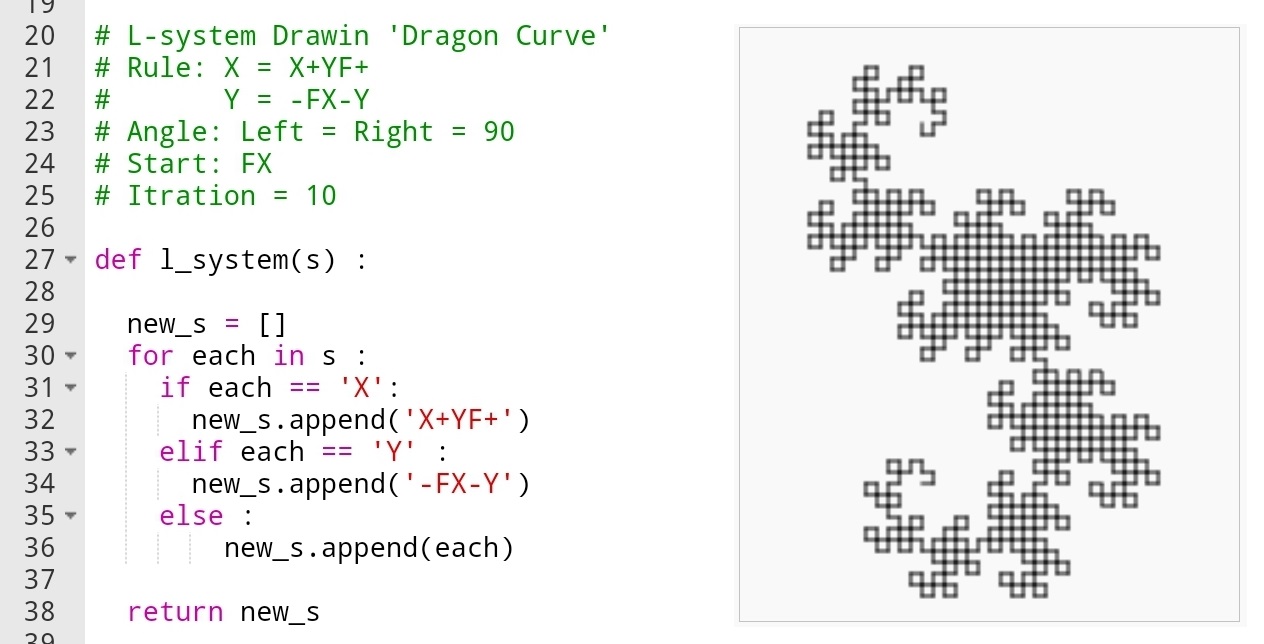 |
L-System: Koch Snowflake 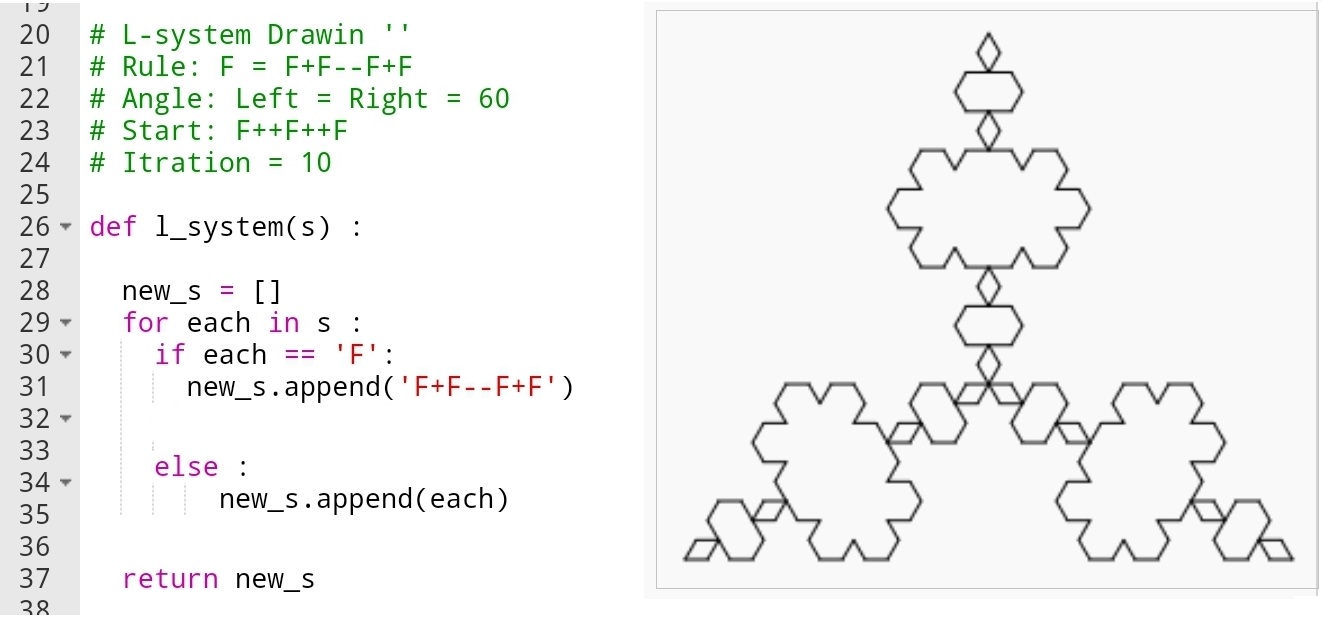 |
L-System: 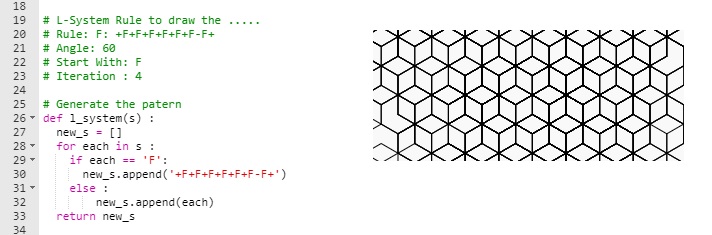 |
L-System:  |
The possibilities to generate the putters and therefore drawing the output is endless, any slightly changes in the iterations or rotation (+ -) angles will take all output to a new levels. In the coming post, I will use the L-system to generate fractal tree and see what we can get from there.
To Download my Python code (.py) files Click-Here
Python and Lindenmayer System – P1
Learning : Lindenmayer System P1
Subject: Drawing with python using L-System
First What is Lindenmayer System or L-System? L-System is a system consists of an alphabet of symbols (A, B, C ..) that can be used to make strings, and a collection of rules that expand each symbol into larger string of symbols.
L-system structure: We can put it as Variables, Constants, Axiom, Rules
Variables (V): A, B, C …
constants : We define a symbols that present some movements, such as ‘+’ mean rotate right x degree, ‘F’ mean move forward and so on ..
Axiom : Axiom or Initiator is a string of symbols from Variable (V ) defining the initial state of the system.
Rules : Defining the way variables can be replaced with combinations of constants and other variables.
Sample:
Variables : A, B {we have two variables A and B}
Constants : none
Axiom : A {Start from A}
Rules : (A → AB), (B → A) {convert A to AB, and convert B to A}
So if we start running the Nx is the number the time we run the rules (Iteration).
N0 : A
N1 : AB
N2 : AB A
N3 : AB A AB
N4 : AB A AB AB A
N5 : AB A AB A AB A AB .. an so-on
So in this example after 5 Iteration we will have this pattern (AB A AB A AB A AB)
In this post we will write two functions, one to generate the pattern based on the Variables and Rules we have. Another function to draw the pattern using Python Turtle and based on the Constants we have within the patterns.
The constants that we may use and they are often used as standard are:
F means “Move forward and draw line”.
f means “Move forward Don’t draw line”.
+ means “turn left by ang_L°”.
− means “turn right ang_R°”.
[ means “save position and angle”.
] means “pop position and angle”.
X means “Do nothing”
and sometime you may add your own symbols and and rules.
First Function: Generate the Pattern will take the Axiom (Start symbol) and apply the rules that we have (as our AB sample above). The tricky point here is that the function is changing with each example, so nothing fixed here. In the coming code i am using only one variable F mean (move forward) and + – to left and right rotations. Other patterns may include more variables. once we finished the function will return the new string list.
Generate the Pattern
|
# Generate the patern def l_system(s) : new_s = [] for each in s : if each == ‘F’: new_s.append(‘F+F+FF-F’) else : new_s.append(each) return new_s |

|
The second function: Draw the Pattern will take the string we have and draw it based on the commands and rules we have such as if it read ‘F’ then it will move forward and draw line, and if it reads ‘-‘ then it “turn right ang_R°”.
here is the code ..
Draw the Pattern
def draw_l_system(x,y,s,b,ang_L,ang_R):
cp = [] # Current position
t.goto(x,y)
t.setheading(90)
t.pendown()
for each in s:
if each == ‘F’ :
t.forward(b)
if each == ‘f’ :
t.penup()
t.forward(b)
t.pendown()
elif each == ‘+’:
t.left(ang_L)
elif each == ‘-‘:
t.right(ang_R)
elif each == ‘[‘:
cp.append((t.heading(),t.pos()))
elif each == ‘]’:
heading, position = cp.pop()
t.penup()
t.goto(position)
t.setheading(heading)
t.pendown()
t.penup()
Now we will just see a one example of what we may get out from all this, and in the next post P2, we will do more sample of drawing using L-System.
In the image bellow, left side showing the Rules, angles and iterations and on the right side the output after drawing the patters.
|
|
To Download my Python code (.py) files Click-Here
Python: Drawing Shapes
Learning : Drawing Shapes
Subject: New shapes function
To Draw a Square shape, we need to know the width ( W ) of the square side, and then we draw a line and moving in 90 degree and drawing another line and so on until we finished the 4 side of the square. In the same principle if we want to draw a triangle (equilateral one), we need to know length of its sides and in mathematics we know that in equilateral triangles the angles (corners) are 120 degree, so we draw a line and move in 120 degree and drawing another two sides.
In coming code, we will write a general function in Python to pass the number on sides we want to draw (triangle =3, Square=4,Pentagon = 5, Hexagon =6 .. and so on), the width (size) of the shape and the position (x,y) of the first angle or point.
The Codes:
def d_shape(s_heads,w,x1,y1):
t.goto(x1,y1)
# To get t.right angle
rang = 360 / s_heads
t.pendown()
for x in range (s_heads +1) :
t.forward(w)
t.right(-rang)
t.penup()

|
Results after using the new function we can pass any number of sides and the function will draw the shape, here are a sample execution of it. .. .. Click to enlarge ..
|
|
|
Now if we call the function number of times equal to it’s heads what we will get ? let’s see . .. Click to enlarge ..
 |
|
| |
 |
And take a look when we set the numbers to 20. .. Click to enlarge ..

|
To Download my Python code (.py) files Click-Here
Taking pictures is not my main daily practices, but when i start playing with my camera, i really enjoy my self.
Thanks for visiting my Space..


