Archive
Python: Pandas Lesson 6
Learning : Panda Lesson 6
Subject: Pass variable to df
In this post we will cover some commands that we will re-use in a coming post were we will start to develop a small system/app to do full managing of our zoo file. currently i am putting the BluePrint of the app, basically the menu will have these functions:
The Menu: [load, view, add-edit-delete, sort, missing data, save to csv …], so lets start..
If we want to add new row to our dataframe, first we need to know our columns name. In our case data file zoo here is the column we have:
( animal, id, water_need, supervisor, cage_no, years ), at this point we will do this as static variable, but in coming lesson we will use an interactive sample.
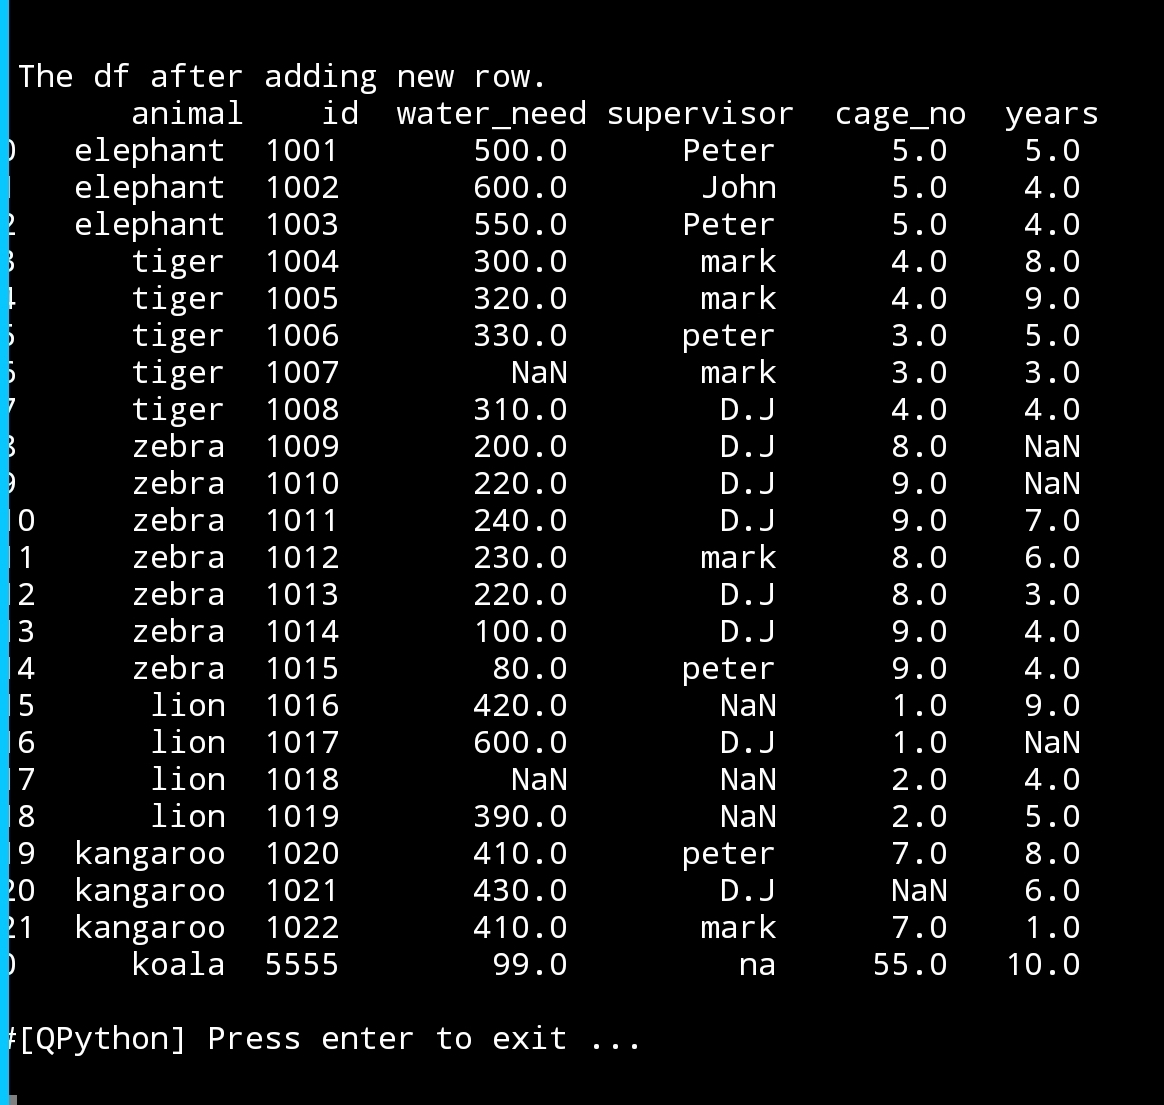
So, we will write a dictionary that hold our new_row and append it to the dataframe.
Add new row to the datafram
new_row={‘animal’:’Koala’,’id’:5555,’water_need’:99,’supervisor’:’na’,’cage_no’:55,’years’:10}
df=df.append([new_row])
print(‘\n\n The df after adding one new row.\n’,df)
|
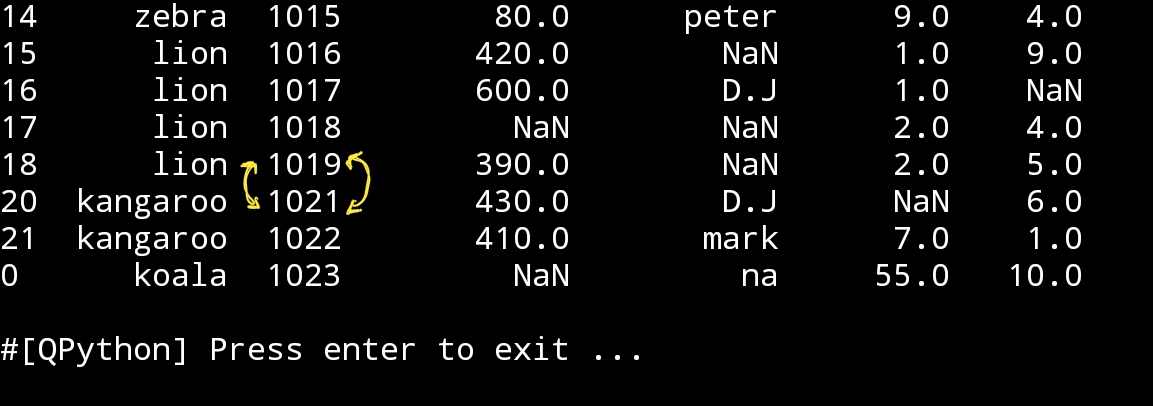
You can see that there is a problem here, the id of our new row was entered manually (in this example) but we need this to be automatic and to do so we must first get the max value in the id column, add 1 to it then use it for the new entry. So we need to add this code:
next_id=df[‘id’].max() + 1
new_row={‘animal’:’koala’,’id’:next_id,’water_need’:99,’supervisor’:’na’,’cage_no’:55,’years’:10}
|
|
To delete a row, we simply re-define the df without that row we want to delete. Say we want to delete the row that has id = 1020. The id is a primary key in our data-set and there is no duplicated numbers in id column so we can use it to identify a specific row. I assume that we know that we read the datafram and we want to delete the row id number 1020, here is the code:
Delete the row with id = 1020
df=df[df.id !=1020]
print(‘\n\n df after deleting row id:1020\n’,df)
|
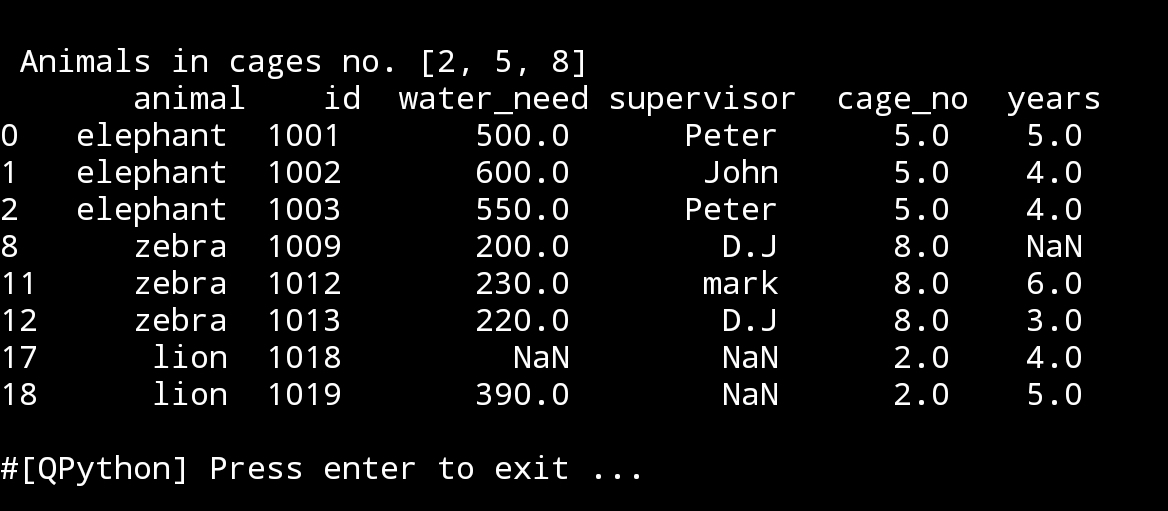
At the first paragraph i was talking about writing an app that fully manage the zoo file, so if the user want to read the rows based on a particular selection like : what are the animals in the cages number 2,5 and 8. Here is the code :
Animals in cage no 2,5 and 8
cage_arr=[2,5,8]
print(‘\n\n Animals in cages no.’,cage_arr,’\n’,df.loc[df[‘cage_no’].isin(cage_arr)])
|
:: Pandas Lessons Post ::
| Lesson 1 | Lesson 2 | Lesson 3 | Lesson 4 |
| Lesson 5 | Lesson 6 | Lesson 7 | Lesson 8 |
| Lesson 9 | Lesson 10 | Lesson 11 | Lesson 12 |
 Follow me on Twitter..
Python: Pandas more commands
Learning : Pandas more commands
Subject: DataFrame Simple Statistics
In this post we will just go through some commands in pandas that related to simple statistics of dataframe, in coming table first we will list down all the commands then will see each in cation.
| Function | Description |
| 1. sum() | Get the sum of the value |
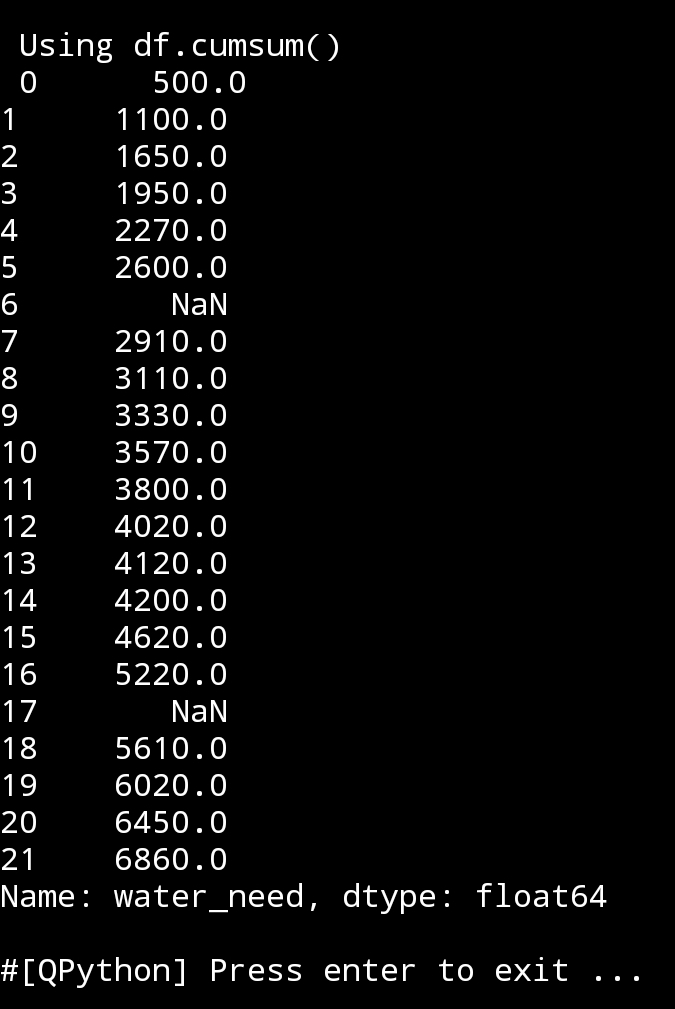
| 2. cumsum() | cumsum() is used to find the cumulative sumvalue over any axis. Each cell is populated with the cumulative sum of the values on upper cells. |
| 3. count() | counting the NaN in the DataFrame. |
| 4. mean() | |
| 5. median | |
| 6. std() | Standard deviation measures the spread of the data about the mean value. |
| 7. max() | Return the maximum value in each column. |
| 8. min() | Return the minimum value in each column. |
| 9. prod() | Return the value of product operation of the items in the column. (works only for number columns) |
| 10. Cumprod() | Return the number in the cell * all the cells over it. |
| 11. abs() | Returns the absolute value of the column and it is only applicable to numeric columns. |
| 12. mode() | It returns the most repeated value in the column. |
1. sum() Using command as: print(df.sum()) it will return a sum of columns, if contain numaric then it will be a normal sum, if it is string return a string contain all as one string without spaces.
In our cas (data_file_zoo) the only practical result is the water-need where it represent the total amout of water we need in our zoo. So to get the sum of one column we can write it as: df[column name].sum()
print(‘\n\n Total amout of water we need is: ‘, df[‘water_need’].sum())
|
|
2. cumsum() Using command as: print(df.cumsum()) cumulative sumvalue will return the number in the cell + the sum of all the cells over it, we may need this function in a data analysis.
|
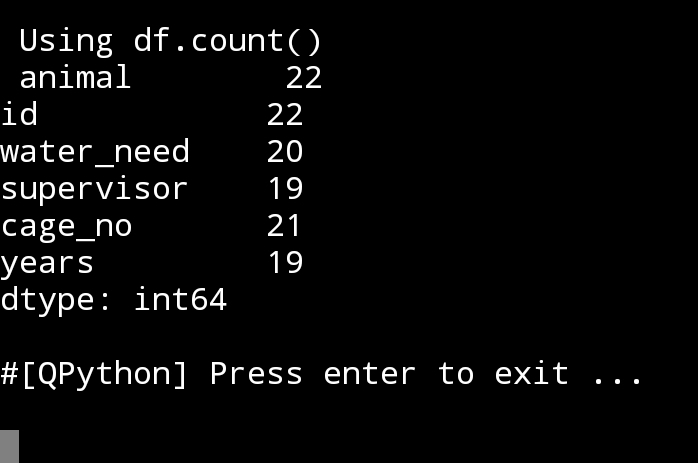
3. count() Using command as: print(df.count()), this function gives us the total data in each columns, so we know how many NaN or empty cells are in our table.
|
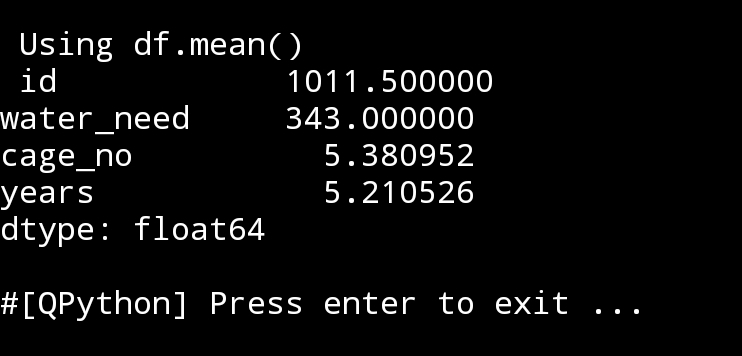
4. mean() Using command as: print(df.mean()), Thw Arithmetic Mean is the average of the numbers in the df for each columns.
|
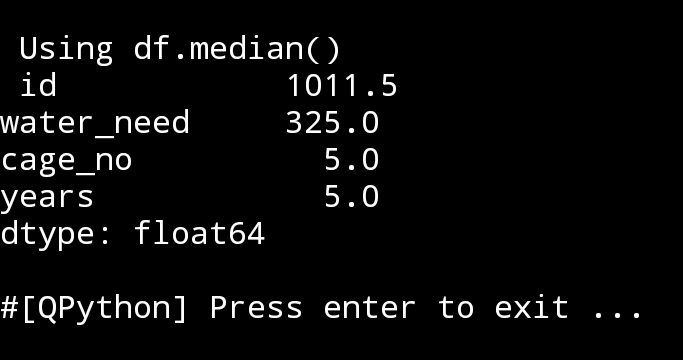
5. median() Using command as: print(df.mediam()), in a sorted list
median will return the middle value, If there is an even number of items in the data set, then the median is the mean (average) of the two middlemost numbers. We can get the median of the specific Column.
# median of water_need column..
print(‘\n\n Median of the Water Need: ‘,df.loc[:,”water_need”].median()
|
6. sdt() Using command as: print(df.std()), it is the Standard deviation of the dataframe, or columns in the df.
The standard deviation measures the spread of the data about the mean value. It is useful in comparing sets of data which may have the same mean but a different range. In our example here (zoo file) some functions is not given the meaning that we may need, but if we have a data from statistical modeled or other scientific field this std() sure will be helpful.
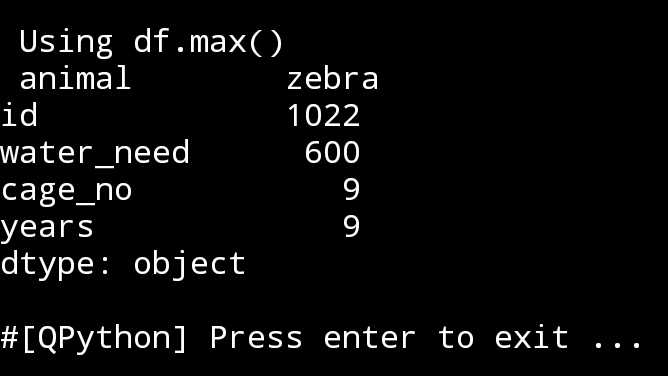
7. max() Using command as: print(df.max()), return the maximum value in each column. If we want the max. value in a specific column then we use theis code:
print(‘\n\n’,df.loc[:,”water_need”].max())
|
8. min() Using command as: print(df.min()), same as max, the min() will return the minimum value in the df for each column, and we can get the min for only one column by using:
print(‘\n\n’,df.loc[:,”water_need”].min())
9. prod() Using command as: print(df.prod()), return the value of product operation of the items in the column. (works only for number columns)
10. cumprod() Using command as: print(df.cumprod()), cumulative product will return the number in the cell * all the cells over it.
To show this i will use a Series of numbers and apply cumprod.
cumprod()
some_value = pd.Series([2, 3, 5, -1, 2])
print(‘\n\n some_value in a column.\n’,some_value)
print(‘\n\n some_value.cumprod()\n’,some_value.cumprod())

|
11. abs() Using command as: print(df.abs()), It returns the absolute value of the column and it is only applicable to numeric columns.
12. mode() Using command as: print(df.mode()), It returns the most repeated value in the column.
Find the most repeated value:
print(‘\n\n Function: df.count()\n’,df.mode())
# mode of the specific column
df.loc[:,”animal”].mode()
:: Pandas Lessons Post ::
| Lesson 1 | Lesson 2 | Lesson 3 | Lesson 4 |
| Lesson 5 |
Python: Pandas Lesson 5
Learning : Pandas Lesson 5
Subject: Columns rename and missing data.
We are still in the same track looking after commands that help us in managing and formatting the dataframe. In most cases, we will have a data file from the net, or from a source that may not consider formatting or standardization as his/their concern, or we may find a lots of missing data in the file. In this post we will go through some lines that will make the file in better shape.
Columns, First thing we will look at is the head of the data table. So First, check your data columns with this code:
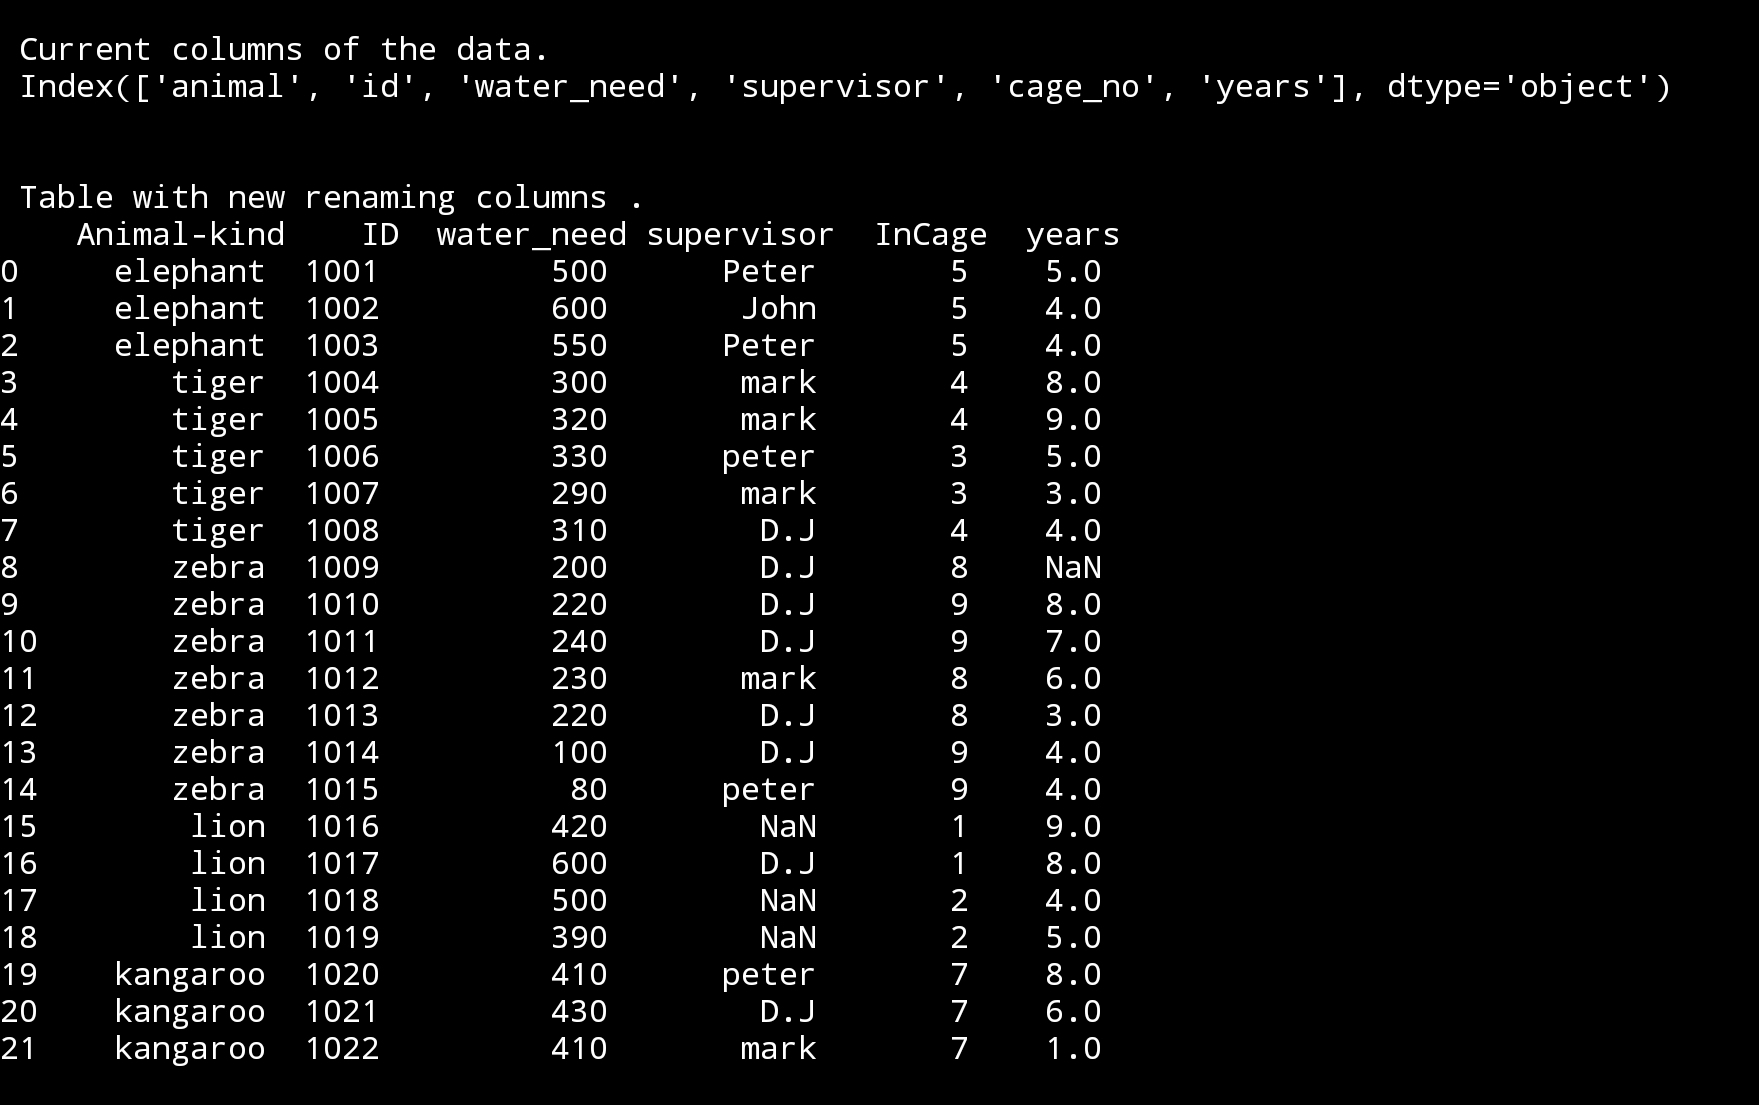
print(‘\n\n Current columns of the data.\n’,df3.columns)
Now we have the a list of the columns in our datafile, and we can change any of them just to give a more clear meaning or any other purpose. I found that using rename method and passing new columns names as dictionary is better because we can rename without order also not stick to rename them all.
df.rename(columns={‘animal’:’Animal-Kind’,’id’:’ID’,’cage_no’:’InCage’}, inplace=True)
print(‘\n\n Table with new renaming columns .\n’,df3)
|
I just forgot to add .sample(6) so we will just have sample data, but anyway the new header is there and we use inplace = True so this new header will stay with us in df3.
Missing Data: This is the biggest challenge in any data file, some time the application that used to fills the form, or the person who entering the data or for any other reasons they are not handling the missing data in a standard way, so you may find just empty field, or ‘NA’ or dummy numbers like (0000), or (-0) or dashes (—). Handling such case is realy depending on the customer you are working for, like what they want to put/write in each empty field, now we are just talking about filling with standard key.
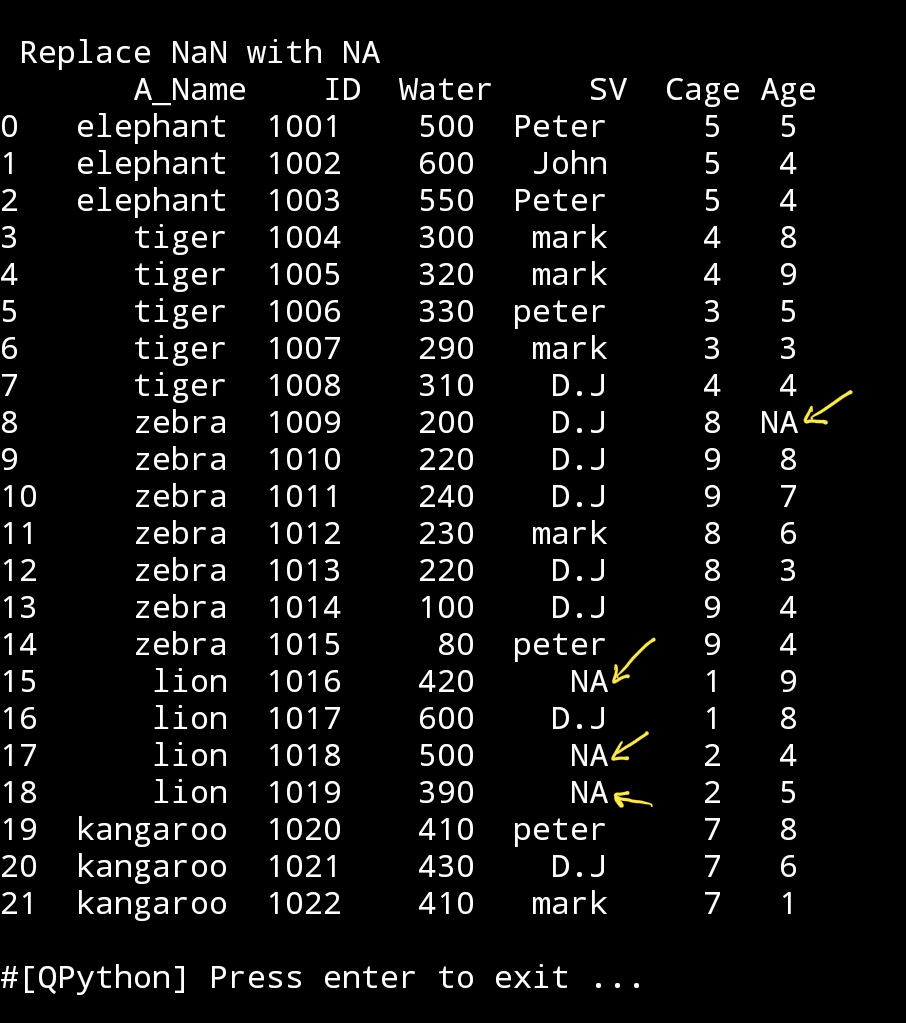
In coming code we are saying to pandas: whenever you found NaN replace it with ‘NA’
new_df=df3.fillna(‘NA’)
print(‘\n\n Replace NaN with NA.\n’new_df)
|
Note This: I will go to our data_file_zoo.csv and just add more NaN to some fields so our coming case will be meaningful.
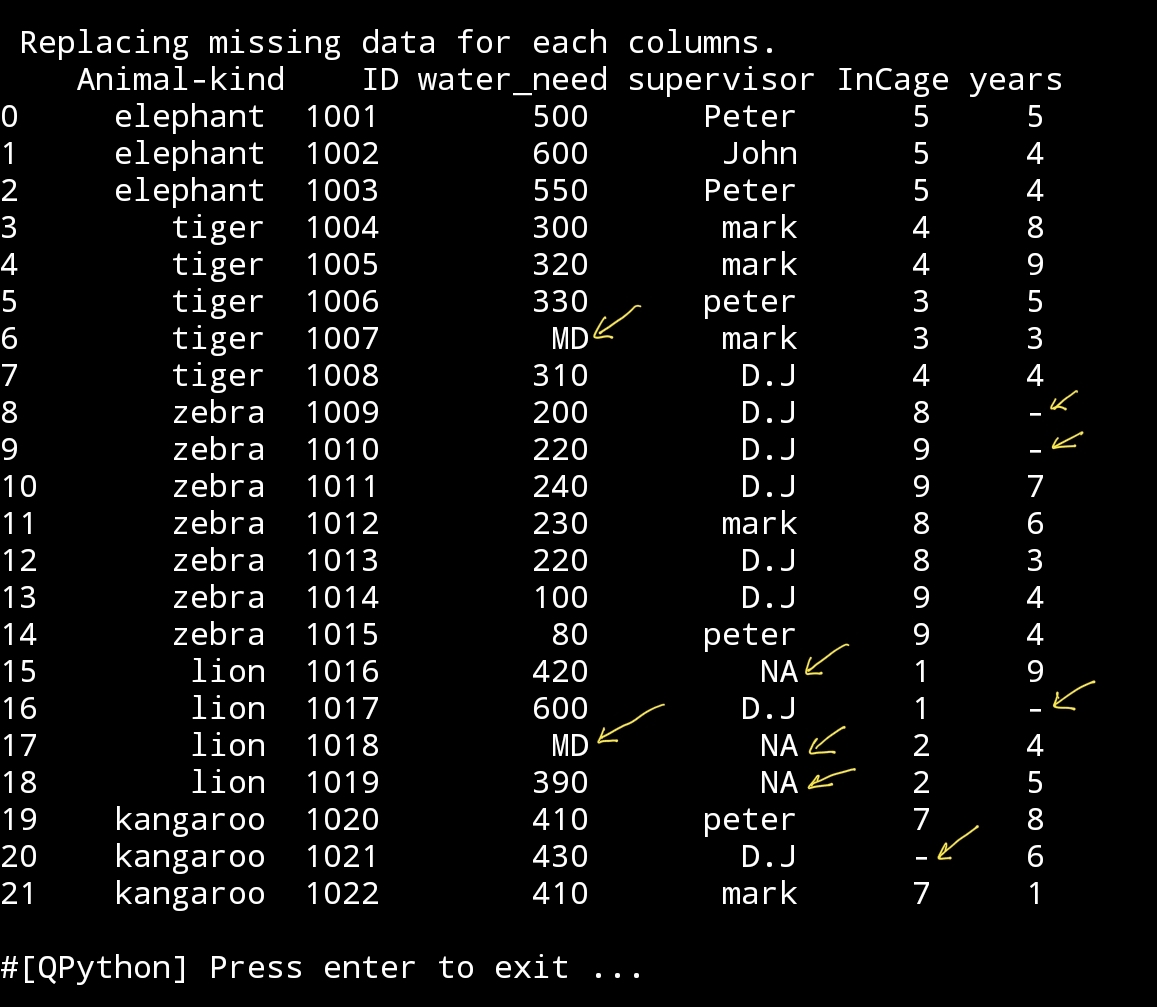
Our data_file_zoo.csv has 6 columns, animal, id are primary keys and can’t be empty, so there MUST be filled. Now for the other columns I will say for each of columns if the data is NaN then we will replace it with:(MD:Missinf Data, NA:Not Available and – for numbers )
water_need : MD
supervisor : NA
InCage : –
years : –
Note That we MUST use the same columns name in the df we are working with.
Here is the code:
Replacing Missing Data
new_df=df2.fillna({‘water_need’:’MD’, ‘supervisor’:’NA’,’InCage’: ‘-‘ ,’years’:’-‘})
print(‘\n\n’,new_df)
|
(I mark the replacing fields.)
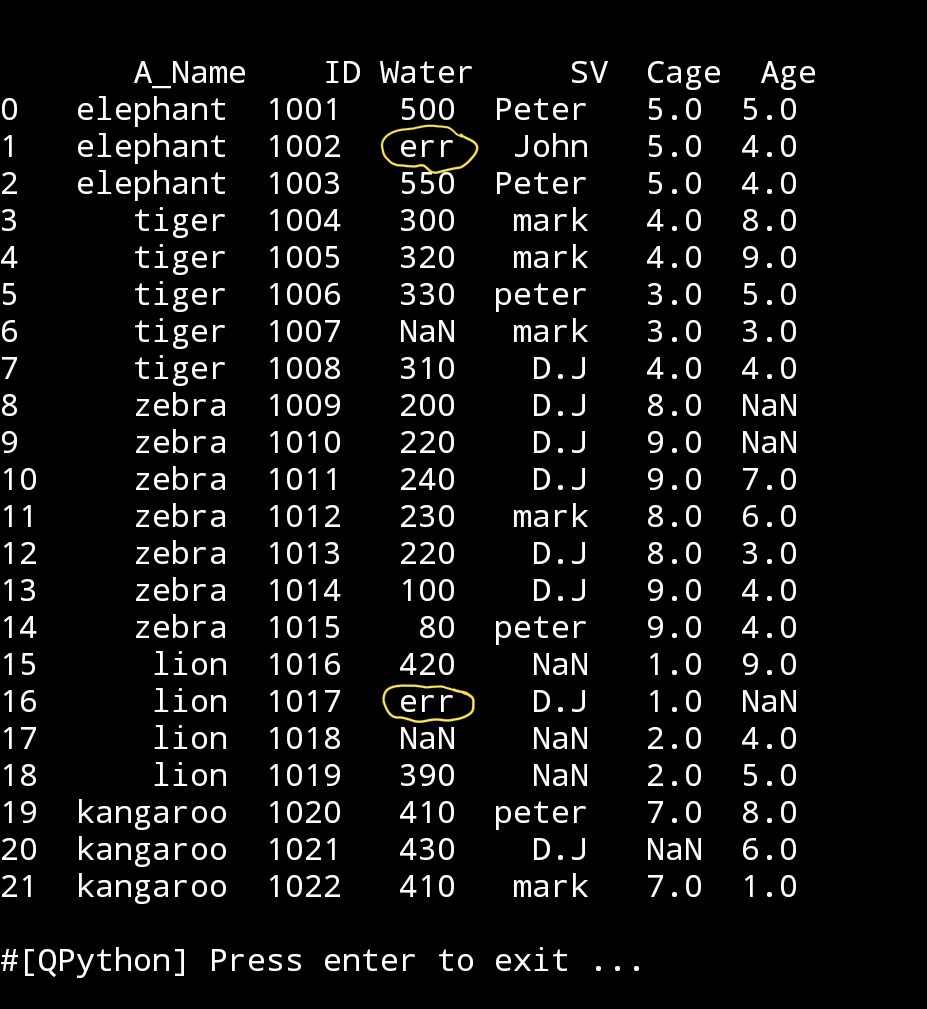
Let’s say we notes that some data in water_need column is not logical, like if we know it can’t be 600, so we just want to replace any number biger that or equal to 600 in that column ot ‘err’. Code here..
Code to change some value based on a condition.
df2.loc[df2[‘Water’] == 600, [‘Water’]] = ‘err’
print (‘\n\n change 600 to err./n’,df2)
|
:: Pandas Lessons Post ::
| Lesson 1 | Lesson 2 | Lesson 3 |
| Lesson 4 | Lesson 5 |
Python: Pandas Lesson 4
Learning : Panda Lesson 4
Subject: DataFrame Columns: Hide, Drop, rename
We still workinng on dataframe and columns, we will go thrght some function and at the end I will just add a line to save the dataframe in a new CSV file. So let’s start.
We still working on our data_file_zoo.csv and here i am copying the column we have in the file or in our df.
print(‘\n\n Columns in thedataFrame..\n’,df.columns)
|
|
Now we have a list of columns in our DataFrame, some time we want to hide a column, here we will creat a variable and whenever we call this variable the column will not be shone on the screen.
Hide column ‘supervisor’
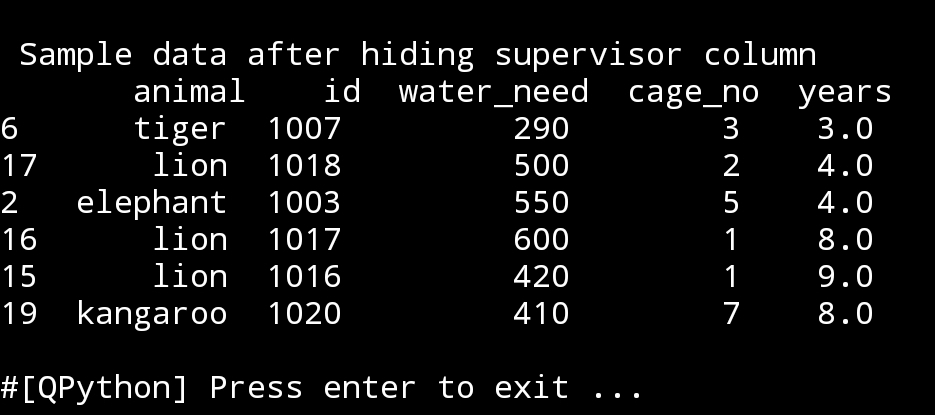
In this line we will set a variable to hide supervisor column, and just for sceen-shop we will present 6 random rows
hide_supervisor=df.drop([‘supervisor’], axis=1)
print(‘\n\n Sample data after hiding supervisor column\n’,hide_supervisors.sample(6))
|
In the upper case, we may have a password column or some key information column that we don’t want to be shown in the dataframe, then it’s good idea to create a DataFrame without this column an use it.
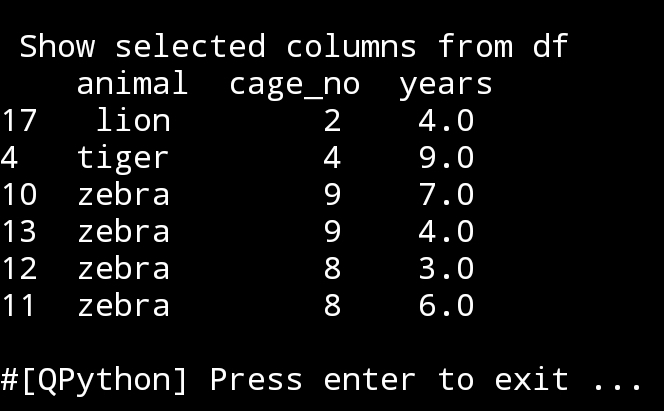
If we have a dataframe and we are examining some thing and don’t want to show all columns every time we print the df, so just show (say three) columns. To do this, first we will print the columns names so we know what we have in the df, then using coming code we will select whatever we want to show.
animal_cage_years=df[[‘animal’,’cage_no’,’years’]]
print(‘\n\n Show selected Columns from df\n’,animal_cage_years.sample(6))
|
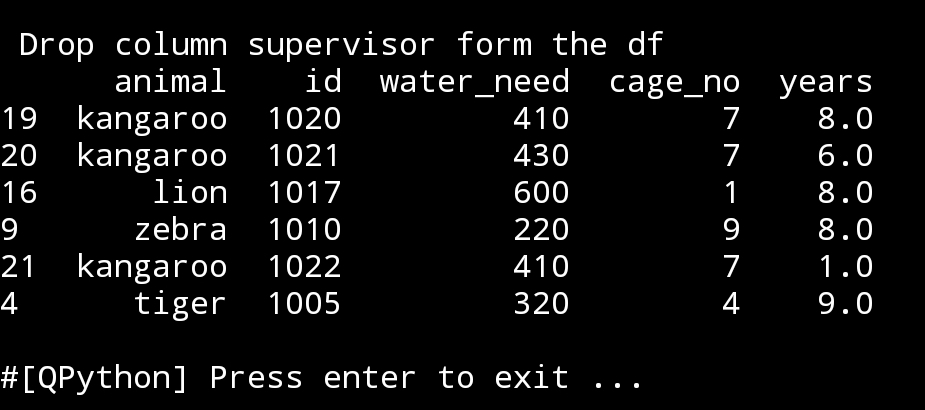
Now we will drop a column from the df, I will select ‘supervisor’, just like this:
print(‘\n\n Drop column ”supervisor” form the df’)
print(df.drop([‘supervisor’],axis=1))
|
To be Aware: In the above case, if we use the command on df and we add inplace=True then this will change the df, so any time we calling the df it will be without the ‘supervisor’ column. Here is the code..
df.drop([‘supervisor’], inplace=True, axis=1)
print(‘\n\n’,df)
If we want to hide more than one columns we just add them in the command like this:
hide_years_cages=df.drop([‘years’,’cage_no’], axis=1)
print(hide_years_cages.sample(6))

|
If we want to check wither or not a df contain column c_name if yes hide-it else print ‘Column not found’.
If column ‘cage_no’ in df hide it.
if ‘cage_no’ in df.columns:
hide_cage = df.drop([‘cage_no’], axis=1)
print(‘\n\n’,hide_cage.sample(6))
else:
print(‘Column not found’)
and we can in the else block just showing another dataframe.
|
:: Pandas Lessons Post ::
| Lesson 1 | Lesson 2 | Lesson 3 | Lesson 4 |
| Lesson 5 |
Python: Pandas Lesson 3
Learning : Pandas Lesson 3
Subject: dataframe (sort, where and filters)
In my Last post Pandaas Lesson 2, we show some commands that will output part of our dataframe (df) such as if we want to output the information we have about lions, or other animals in the Zoo file. Or to see what aminals fell under particular supervisor. Also I try to add a print statment over each output table to show/describe the table content.
In theis Lesson, or let’s say in this post I will share another bunch of commands dealing with one table of data. We will keep using our Zoo data file. So first I wll call the dataframe df.
import pandas as pd
file_name=’data_file_zoo.csv’
df=pd.read_csv(file_name, delimiter=’,’)
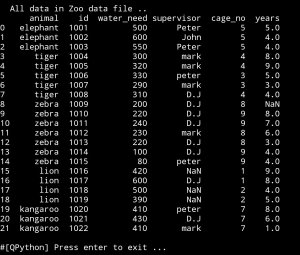
print(‘\n Data from Zoo file..’,df)
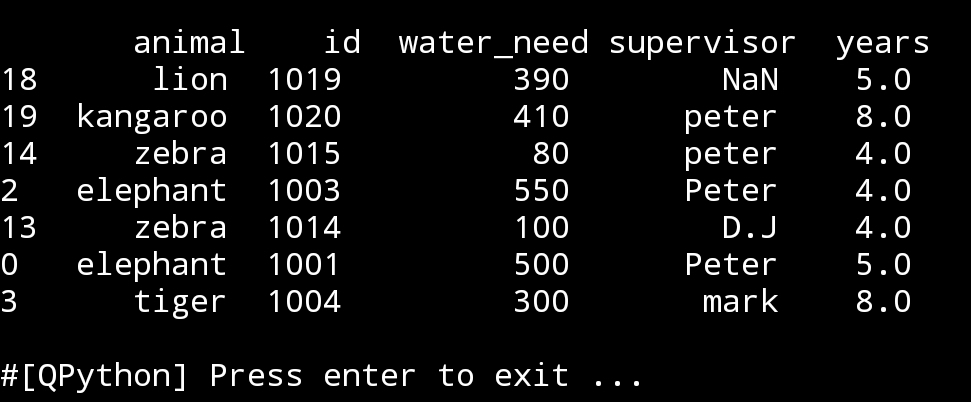
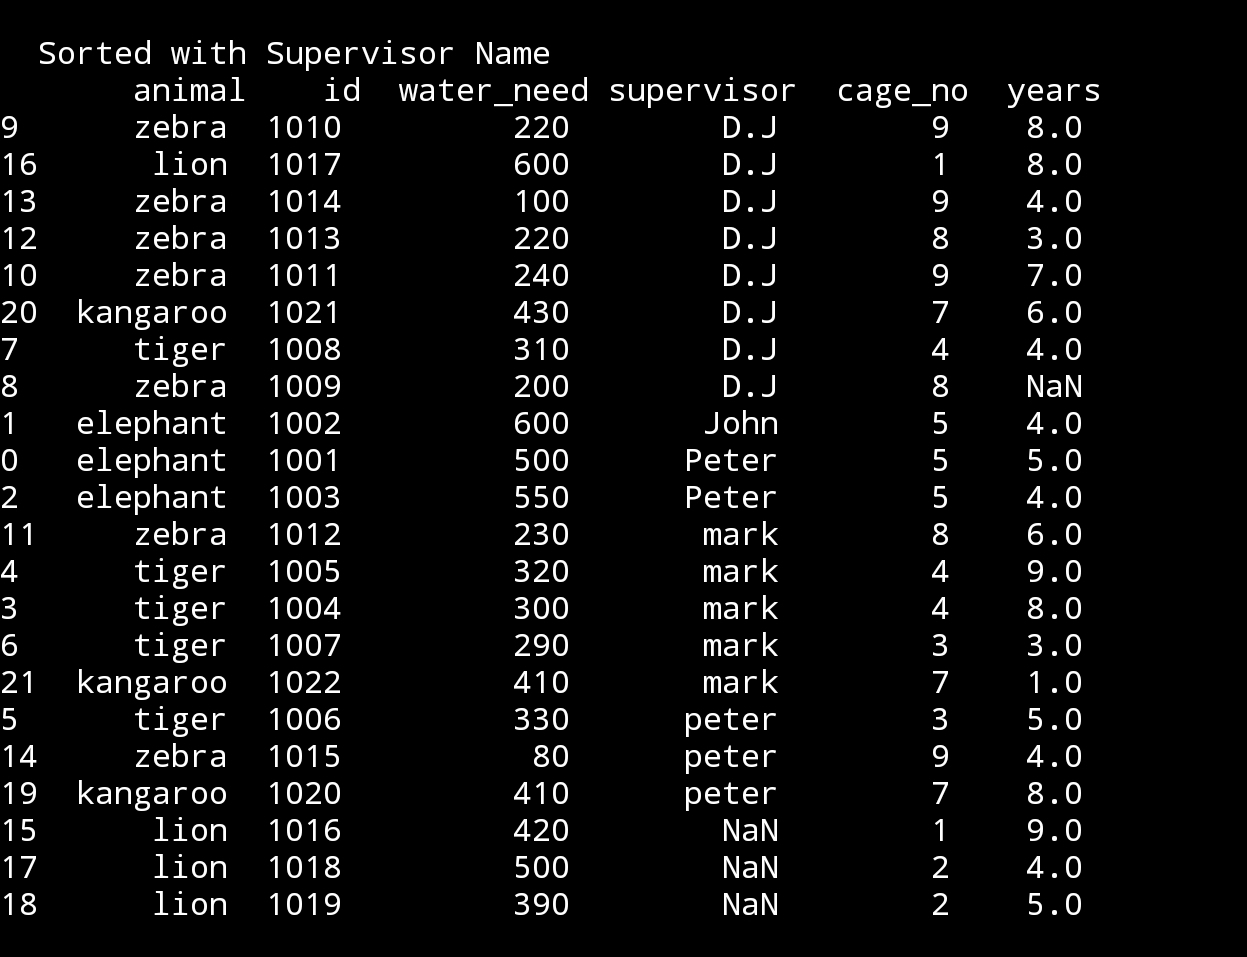
So, if we want to sort the data based on supervisor name.
df.sort_values(‘supervisor’, inplace=True)
print(‘\n\n Sorted data with Supervisor Name\n’,df)
|
First thing to notes that we have two group of supervisors name ‘peter’ one with small ‘p’, another with Big ‘P’. Another thing to see that we have some ‘lions’ with NaN under supervisor, this meas there is no data in that feilds. I will not change this now, let’s do this in another lesson.
So, let’s sort the data now with anumal type.
df.sort_values(‘animal’,inplace=True)
print(‘\n\n Sort with animal type.\n’,df)
 |
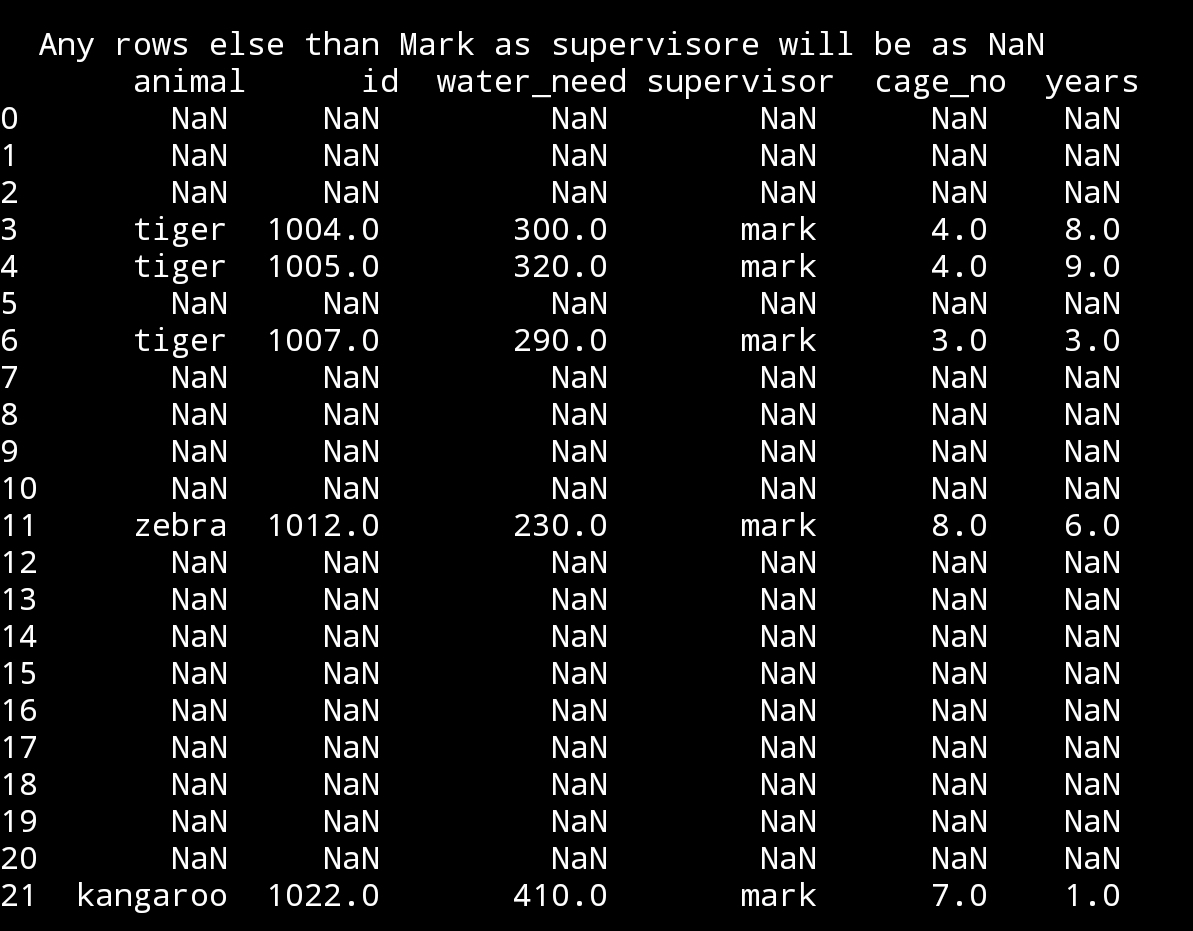
If we want to print all animal data under mark supervision, other data will be shown as NaN.
mark_supervision = df[‘supervisor’]==’mark’
df.where(mark_supervision, inplace = True)
print(‘\n\n Any rows else than Mark as supervisore will be as NaN\n’,df)
|
If we want to add another filter to the upper dataframe to show animals under mark supervision if the animal age is more than 7.
age_biger_7 = df[‘years’] >7
df.where(mark_suoervision & age_biger_7, inplace = True)
print(‘\n\n Only rows under mark supervision if animal age > 7 \n’,df)

|
:: Pandas Lessons Post ::
| Lesson 1 | Lesson 2 | Lesson 3 | Lesson 4 |
| Lesson 5 |
Python: Pandas Lesson
Learning : DataFrame and some commands
Subject: Pandas printing selected rows
First thing we will do today, we will add another coloumn to our CSV data_file_zoo.csv, we will add ‘years’ this will be hwo old each animal in the zoo is.
File_Name: data_file_zoo.csv
animal,id,water_need,supervisor,cage_no,years
elephant,1001,500,Peter,5,5
elephant,1002,600,John,5,4
elephant,1003,550,Peter,5,4
tiger,1004,300,mark,4,8
tiger,1005,320,mark,4,9
tiger,1006,330,peter,3,5
tiger,1007,290,mark,3,3
tiger,1008,310,D.J,4,4
zebra,1009,200,D.J,8,
zebra,1010,220,D.J,9,8
zebra,1011,240,D.J,9,7
zebra,1012,230,mark,8,6
zebra,1013,220,D.J,8,3
zebra,1014,100,D.J,9,4
zebra,1015,80,peter,9,4
lion,1016,420,,1,9
lion,1017,600,D.J,1,8
lion,1018,500,,2,4
lion,1019,390,,2,5
kangaroo,1020,410,peter,7,8
kangaroo,1021,430,D.J,7,6
kangaroo,1022,410,mark,7,1
As we just update out file, we need to load it to the memory by calling the df (dataframe), this will happen once we run our code.
Here is a screen shot of the new data using print(df)
Lets say we want to know how many animals are numder 6 years. Here we will use df.loc to locate what we are looking for.
age_less_6 = df.loc[(dfyears<6)]
# To print we may use this:
print(‘ we have {} animals less than 6 years’.format(len(age_less_6)))
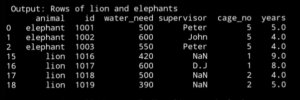
Now, we want to print only lion rows:
lino_rows = df.loc[(df.animal==’lion’)]
 Here is only rows with animal name ‘elephants’:
elephant_rows=df.loc[(df.animal==’elephant’)]

Now let’s print only the rows with lion and elephants:lion_and_elephant = df.loc[(df.animal==’lion’) | (df.animal == ‘elephant’)]
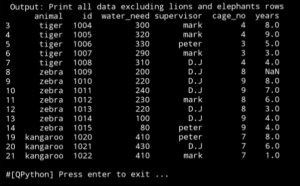
What if we want all the data but not the rows with lino or elephant.
all_exclude_lion_elephant=df.loc[(df.animal !=’lion’) & (df.animal !=’elephant’)]
:: Pandas Lessons Post ::
| Lesson 1 | Lesson 2 | Lesson 3 | Lesson 4 |
| Lesson 5 |
Python: Triangle, Pentagonal, and Hexagonal
Python: Triangle, Pentagonal, and Hexagonal
Problem No.45 @ Projecteuler
Completed on: Thu, 11 Jul 2019, 21:31
Another straight-forward problem, in this task I create three functions each for Triangle, Pentagonal, and Hexagonal and we return the value of the formulas as been stated in the problem.
Using a for loop and a number range, I store the results in a list tn, pn, hn. then comparing the values in the three lists searching for same value.

|
The Code:
# P45
# Solved
# Completed on Thu, 11 Jul 2019, 21:31
def tn (n) :
return int(n*(n+1)/2)
def pn(n):
return int(n*(3*n-1)/2)
def hn (n):
return int(n*(2*n-1))
tn_list =[]
pn_list=[]
hn_list=[]
n = 0
# Notes: I run the code for large range, but to save more time after 5000 i select +10,000 each time.
for n in range (5000,60000):
tn_list.append(tn(n))
pn_list.append(pn(n))
hn_list.append(hn(n))
print ([x for x in tn_list if x in pn_list and x in hn_list])

|
Python: Powerful Digit Counts
Python: Powerful Digit Counts
Problem No.63 @ ProjectEuler
Completed on: Completed on Thu, 11 Jul 2019, 17:21
Just to make my post simple, i am quoting from ProjectEuler page
The 5-digit number, 16807=75, is also a fifth power. Similarly, the 9-digit number, 134217728=89, is a ninth power.
How many n-digit positive integers exist which are also an nth power?
Then, we need to find the loop that will solve this, and we did..
|
|

The Code:
# P63
# Power digit count
# Solved
# Completed on Thu, 11 Jul 2019, 17:21
c = 0
for x in range (1,50):
for p in range (1,50) :
if (len(str(x**p)) == p ):
c += 1
print(‘\n We have {} n-digit integers exist which are also an nth power.’.format(c))
Python: Pentagon Numbers
Python: Pentagon Numbers
Problem No.44 on ProjectEuler
Completed on: Thu, 11 Jul 2019, 18:37
This problem talking about the Pentagonal numbers and gives us a formula. Using that formula for a certain range of numbers, the generated sequence showing that P4 + P7 = 22 + 70 = 92, 92 is the P8, but if we subtracting (P7 – P4) = 70 – 22 = 48, 48 is not in the generated sequence of pentagonal numbers, so 48 is not pentagonal.
The task here is to find the pair of pentagonal Pj,Pk which their sum and difference are Pentagonal D = Pk – Pj is minimised.(we need to get the D).

|
The Code:
# P44
# Pentagon Numbers
# Solved
#Completed on Thu, 11 Jul 2019, 18:37
def pn(n):
return int(n*(3*n-1)/2)
pn_list=[]
for n in range (1000,3000) : # I start increasing the range step by step.
pn_list.append(pn(n))
we_found_it = False
for x in range (0,len(pn_list)-1) :
px= pn_list[x]
for y in range (x+1,len(pn_list)-1) :
py= pn_list[y]
if (px+py) in pn_list:
if (py-px) in pn_list:
print(‘\n We found one ‘,px,py,’D = ‘,py-px )
we_found_it = True
if we_found_it : break
print(‘Done’)
|
|

Python is_prime and time consuming
Python: is_prime and time consuming
Function enhancement
Once i start solving projectEuler problems i notes that i need the prime numbers in most of cases, so I wrote a function called ‘is_prime’ and it works fine. Some time just to get all the primes in a given range takes some seconds, seconds in computer time means waiting a lot. With some other problems that we need to get the prime in large numbers my function looks slow, since I am not deep in math I search the net for a better way to get the primes or to check if a given number is prime or not.
Definition A prime number (or a prime) is a natural number greater than 1 that cannot be formed by multiplying two smaller natural numbers. wikipedia.org. So as I understand a prime number is not dividable by any other numbers, so my is_prime function is taking a number let’s say n= 13, and start a loop from 2 to n=13 if we fond a number that divide 13 then 13 is not a prime.
Here is the code:
def is_prime1(num):
for t in range (2, num):
if num % t == 0 :
return False
return True
The function is working fine and we can get the prime numbers, but as I mention above, if we have a large number or a wide range, this will take some time. After searching the web, I found some facts regarding the Prime Numbers:
1. The only even prime number is 2. (So any other even numbers are not prime)
2. If the sum of a number digits is a multiple of 3, that number can be divided by 3.
3. No prime number greater than 5 ends in/with 5.
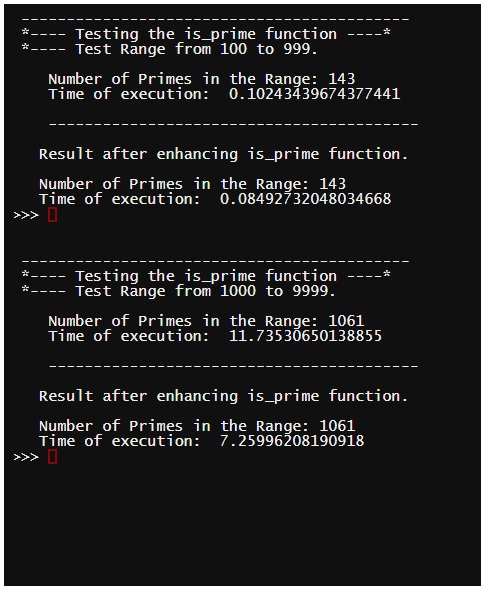
OK, now I can first cut any range to half by not going through even numbers (if even false). Then, I will see if the number end with 5 or not (if end with 5 false),last I will do a summation of the digits in the number if the sum divide by 3 (if yes false), and if the number pass then i will take it in the loop from 5 to n, and if any number divide it we will return false.
Here is the code after the enhancement:def is_prime2(num):
if num %2==0 : # pass the even numbers.
return False
num_d= str(num) # if last digits is 5, then not prime
t= len(num_d)
if (num_d[t-1]) == 5 :
return False
tot = 0
for each in str(num):
tot = tot + int(each)
if tot % 3 == 0 : # if digits sum divide by 3, then not prime
return False
for t in range (3, num, 2):
if num % t == 0 :
return False
return True
I test both function on my laptop, for different number ranges, and use the time function to see the time delays with each one. Here is the results. If any one know better way to do this please drop it here. Or on My Twitter.
|
Taking pictures is not my main daily practices, but when i start playing with my camera, i really enjoy my self.
Thanks for visiting my Space..


